If you read part 1 of this series, you know that my crawler was plagued by several memory leaks.
Using umdh, I was able to determine that lxml was the culprit. That's a start! But why did those leaks occur in the first place? And how could I fix them?
In this second and final post of the series, you'll find out how I used a combination of techniques and tools to analyze and resolve memory leaks in my Python application.
Leak #1
Step 1: asking for help on lxml's mailing list
With umdh, I was able to determine that lxml was potentially causing this first memory leak:
+   63776 (  69440 -   5664)   2170 allocs    BackTrace7922D60
+    1993 (   2170 -    177)    BackTrace7922D60    allocations
    ntdll! ?? ::FNODOBFM::`string'+000153EB
    ucrtbase!malloc+00000031
    etree!xmlDictLookup+0000025E
    etree!xmlHashAddEntry3+00000053
    etree!xmlHashAddEntry+00000014
    etree!xmlAddID+0000011D
    etree!xmlSAX2AttributeInternal+0000078A
    etree!xmlSAX2StartElement+000002AE
    etree!htmlParseStartTag+00000579
    etree!htmlParseElementInternal+00000069
    etree!htmlParseContentInternal+000003D3
    etree!htmlParseDocument+000002A2
    etree!htmlDoRead+00000094
    etree!htmlCtxtReadMemory+00000093
    etree!__pyx_f_4lxml_5etree_11_BaseParser__parseUnicodeDoc+0000028A
    etree!__pyx_f_4lxml_5etree__parseDoc+0000041F
    etree!__pyx_f_4lxml_5etree__parseMemoryDocument+000000E6
    etree!__pyx_pf_4lxml_5etree_22fromstring+00000086
    etree!__pyx_pw_4lxml_5etree_23fromstring+00000294
    ...
    python33!PyEval_EvalFrameEx+00002041
    python33!PyEval_EvalCodeEx+0000065C
    python33!fast_function+0000014D
    python33!call_function+00000339
    python33!PyEval_EvalFrameEx+00001F98
So a sequence of calls - originating from etree.fromstring() and going all the way down to malloc() - had caused 2170 memory allocations to not be freed.
I found that it was a known issue in lxml, which apparently had not been fixed since 2011. But I wasn't satisfied with this finding; there had to be a solution to such a long-standing issue!
So I posted a question to lxml's mailing list, and I received a very interesting response from lxml's author:
Hi!
By default, lxml configures the parser to collect and remember IDs used in
the documents. The dict that stores the names is shared globally in order
to reduce overall memory consumption across documents.
You can disable this for ID names by creating a parser with the option
collect_ids=False.
Stefan
Great! So my issue was kind of a false positive after all; it was not a real leak. lxml was simply accumulating ID attributes in a global dictionary for performance purposes. And that dictionary was intentionally not cleared. It's why umdh had detected this as a memory leak.
There was a very easy solution, fortunately! Just passing the right setting (collect_ids=False) to one of lxml's classes would theoretically solve my problem.
Step 2: inspecting the source code of lxml
Okay, but I wasn't exactly sure how to use collect_ids. So I looked at the source code of html.fromstring(), the function I was using to parse HTML pages.
def fromstring(html, base_url=None, parser=None, **kw):
    ...
    if parser is None:
        parser = html_parser
    ...
    doc = document_fromstring(html, parser=parser, base_url=base_url, **kw)
    ...
Interesting! Internally, it was using an instance of the HTMLParser class. This was probably the "parser" that Stefan Bermel was referring to.
But I was quite perplexed when I saw the source code of the latter1:
cdef class HTMLParser(_FeedParser):
    def __init__(self, *, encoding=None, remove_blank_text=False,
                 remove_comments=False, remove_pis=False, strip_cdata=True,
                 no_network=True, target=None, XMLSchema schema=None,
                 recover=True, compact=True):
        ...
        _BaseParser.__init__(self, parse_options, 1, schema,
                             remove_comments, remove_pis, strip_cdata, True,
                             target, encoding)
No collect_ids setting in sight! Yikes! Wasn't it supposed to be configurable?
Hum... And what about the XMLParser class?
cdef class XMLParser(_FeedParser):
    def __init__(self, *, encoding=None, attribute_defaults=False,
                 dtd_validation=False, load_dtd=False, no_network=True,
                 ns_clean=False, recover=False, XMLSchema schema=None,
                 huge_tree=False, remove_blank_text=False,
                 resolve_entities=True,
                 remove_comments=False, remove_pis=False, strip_cdata=True,
                 collect_ids=True, target=None, compact=True):
        ...
        _BaseParser.__init__(self, parse_options, 0, schema,
                             remove_comments, remove_pis, strip_cdata,
                             collect_ids, target, encoding)
Oh, collect_ids is right there! So HTMLParser didn't provide any way to configure it, whereas XMLParser did.
But really? Was I seeing things clearly, or was my brain turning into one giant pothole?
Step 3: asking for clarifications on lxml's mailing list
So I asked the mailing list once again, just to make sure that I didn't miss something.
I was quite surprised to receive this response a few days later:
FYI, Just sent a pull request: https://github.com/lxml/lxml/pull/216
Best,
Burak
Not even time to breathe! This generous developer had actually just made the collect_ids setting configurable in the HTMLParser class! How cool was that, seriously? This - along with other improvements - resulted in a new release of lxml. Amazing!
Step 4: testing out the collect_ids setting for HTMLParser
So I downloaded the source code of lxml 3.7.0, built it myself to get its debug symbols and installed it using pip.
Then, I changed my code as follows:
from lxml import html
xml_tree = html.fromstring(content, parser=html.HTMLParser(collect_ids=False))
And guess what? The "leak" was no longer reported in umdh logs! Problem solved!
Leaks #2 and #3
Step 1: inspecting the source code of libxml2
Now, I didn't know much about the other two leaks. Except that nobody had reported them. Apparently. Yet.
And they seemed to have something in common with the first "leak". Just take a close look at their allocation stacks:
+    6048 (   7328 -   1280)    229 allocs    BackTrace7819DE0
+     189 (    229 -     40)    BackTrace7819DE0    allocations
    ntdll! ?? ::FNODOBFM::`string'+000153EB
    ucrtbase!malloc+00000031
    etree!xmlDictLookup+0000025E
    etree!htmlParseHTMLName+000000C8
    etree!htmlParseStartTag+00000315
    etree!htmlParseElementInternal+00000069
    etree!htmlParseContentInternal+000003D3
    etree!htmlParseDocument+000002A2
    etree!htmlDoRead+00000094
    etree!htmlCtxtReadMemory+00000093
    etree!__pyx_f_4lxml_5etree_11_BaseParser__parseUnicodeDoc+0000028A
    etree!__pyx_f_4lxml_5etree__parseDoc+0000041F
    etree!__pyx_f_4lxml_5etree__parseMemoryDocument+000000E6
    etree!__pyx_pf_4lxml_5etree_22fromstring+00000086
    etree!__pyx_pw_4lxml_5etree_23fromstring+00000294
    ...
    python33!PyEval_EvalFrameEx+00001F98
    python33!fast_function+000000D8
    python33!call_function+00000339
    python33!PyEval_EvalFrameEx+00001F98
    python33!fast_function+000000D8
    ...
+    1440 (   1568 -    128)     49 allocs    BackTrace7922FA0
+      45 (     49 -      4)    BackTrace7922FA0    allocations
    ntdll! ?? ::FNODOBFM::`string'+000153EB
    ucrtbase!malloc+00000031
    etree!xmlDictLookup+0000025E
    etree!htmlParseName+000000C3
    etree!htmlParseEntityRef+00000054
    etree!htmlParseHTMLAttribute+0000012E
    etree!htmlParseAttValue+0000002B
    etree!htmlParseStartTag+0000039D
    etree!htmlParseElementInternal+00000069
    etree!htmlParseContentInternal+000003D3
    etree!htmlParseDocument+000002A2
    etree!htmlDoRead+00000094
    etree!htmlCtxtReadMemory+00000093
    etree!__pyx_f_4lxml_5etree_11_BaseParser__parseUnicodeDoc+0000028A
    etree!__pyx_f_4lxml_5etree__parseDoc+0000041F
    etree!__pyx_f_4lxml_5etree__parseMemoryDocument+000000E6
    etree!__pyx_pf_4lxml_5etree_22fromstring+00000086
    etree!__pyx_pw_4lxml_5etree_23fromstring+00000294
    ...
    python33!PyEval_EvalCodeEx+0000065C
    python33!fast_function+0000014D
    python33!call_function+00000339
    python33!PyEval_EvalFrameEx+00001F98
    python33!fast_function+000000D8
Woahh! They mostly contain the same function calls! For example, etree::htmlParseStartTag() and etree::xmlDictLookup() were present in each allocation stack2.
But those stacks also differed slightly. For example, etree::htmlParseHTMLName() and etree::htmlParseAttValue() were found in each one respectively. This suggested that the two leaks didn't occur exactly for the same reasons. Or so I thought.
So I peeked into the source code of etree::htmlParseStartTag() to better understand how it works.
Here's my takeaway as a diagram:
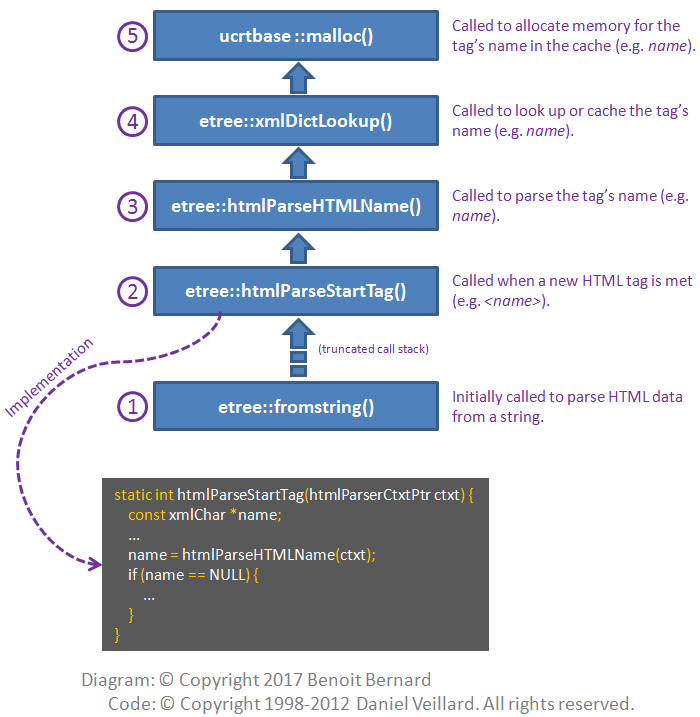
Besides, it seemed to me that htmlParseStartTag() was not releasing the name pointer allocated by htmlParseHTMLName(). But who the hell was I to be 100% sure about that? Maybe it was released somewhere else that I didn't see - or maybe not.
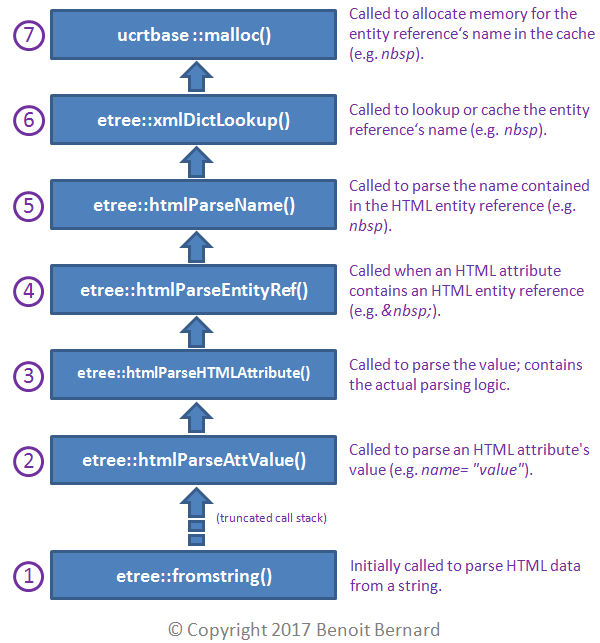
And what about etree::htmlParseAttValue()? Well, this is what it did internally:
I felt that there was something fishy going on. etree::xmlDictLookup() was everywhere, and it was responsible for the final call to malloc(). But looking at its source code hardly provided any relief; it was pretty hard to understand.
So I asked yet another question on lxml's mailing list.
But in the meantime, I would certainly not wait in my pajamas eating ice cream. Or would I?
Step 2: debugging libxml2 using WinDbg
Debugging libxml2 was the only way I could be sure about its behavior. But first, I had to reproduce the leaks in a controlled environment.
Through trial and error, I found a website (thanks Jeff Atwood!) that was causing the leaks I had observed. So I saved its HTML source to a text file, and came up with a very small unit test that called the single function causing the leaks:
import os
from lxml import html
def test_leaks():
    input("Attach to process ID {0} with a debugger and press any key...".format(os.getpid()))
    print("Running test...")
    with open("C:\\tmp\\leaks\\coding_horror_source.txt", encoding="utf-8") as file:
        html_document = html.fromstring(file.read())
if __name__ == "__main__":
    test_leaks()
Then I turned to WinDbg, a low-level debugger for Windows. Here's what I did3:
- I launched my Python unit test.
- I launched WinDbg.
- I chose File > Attach to a Process.
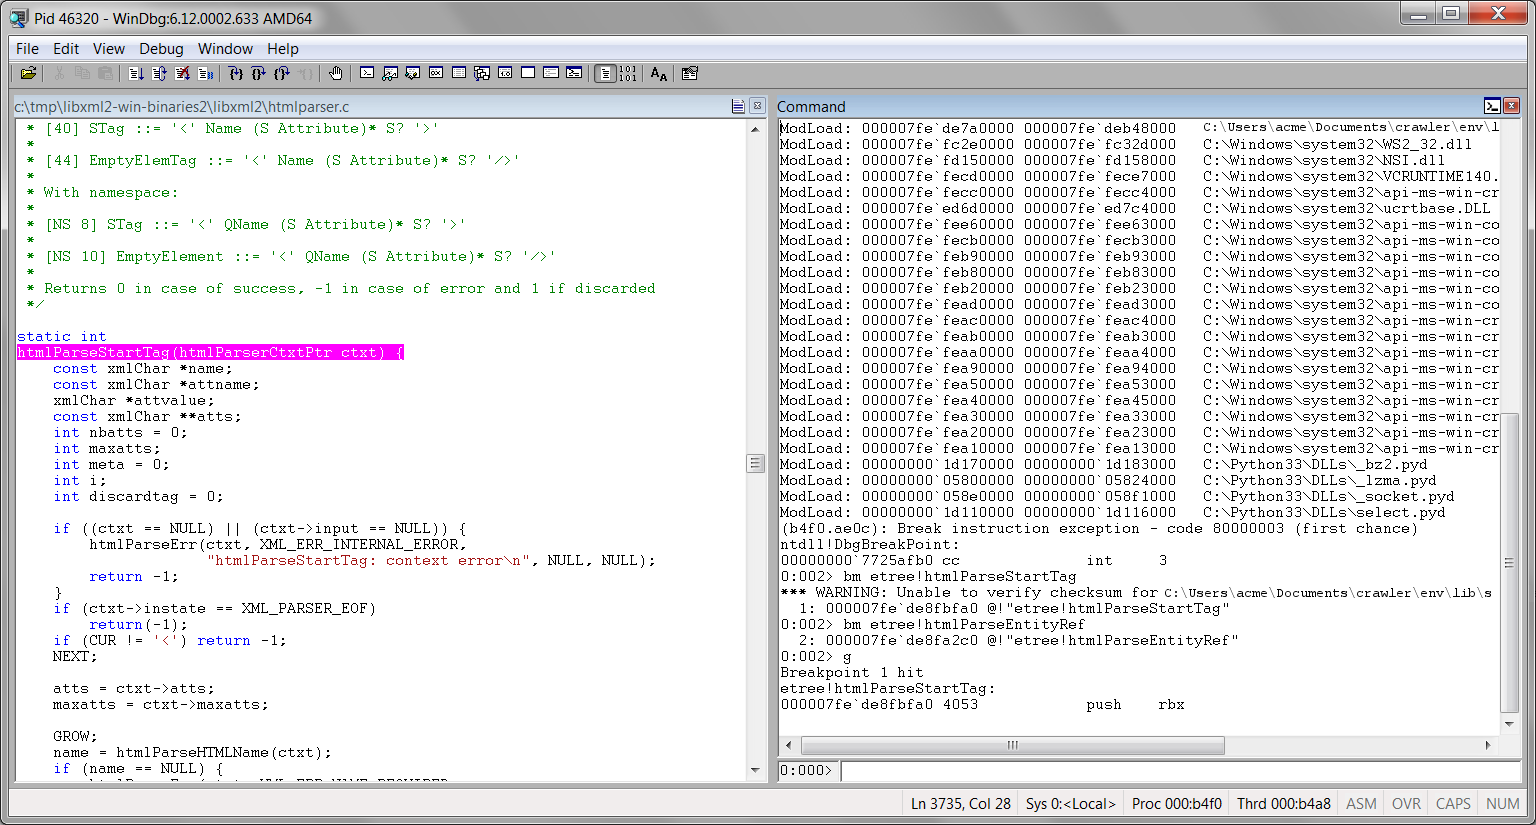
I chose the Python process that I wanted to debug and I hit OK. This is what I saw in WinDbg:
*** wait with pending attach
Symbol search path is: C:\Python33\Symbols;srv*c:\mycache*https://msdl.microsoft.com/download/symbols
Executable search path is:
ModLoad: 00000000`1d000000 00000000`1d00f000   C:\Users\acme\Documents\crawler\env\Scripts\python.exe
ModLoad: 00000000`77210000 00000000`773ba000   C:\Windows\SYSTEM32\ntdll.dll
ModLoad: 00000000`76ff0000 00000000`7710f000   C:\Windows\system32\kernel32.dll
ModLoad: 000007fe`fbe30000 000007fe`fbe9a000   C:\Windows\system32\KERNELBASE.dll
ModLoad: 00000000`1e000000 00000000`1e3d1000   C:\Windows\system32\python33.dll
...
ModLoad: 000007fe`feaa0000 000007fe`feab8000   C:\Python33\DLLs\python3.dll
ModLoad: 00000001`80000000 00000001`8010a000   C:\Python33\DLLs\_hashlib.pyd
ModLoad: 000007fe`db100000 000007fe`db4a8000   C:\Users\acme\Documents\crawler\env\lib\site-packages\lxml\etree.pyd
...
(be94.b61c): Break instruction exception - code 80000003 (first chance)
ntdll!DbgBreakPoint:
00000000`7725afb0 cc              int     3
I put breakpoints on the htmlParseStartTag() and htmlParseEntityRef() functions, just to be sure that I would hit the same code paths as in umdh logs:
0:002> bm etree!htmlParseStartTag
  1: 000007fe`db25bfa0 @!"etree!htmlParseStartTag"
0:002> bm etree!htmlParseEntityRef
  2: 000007fe`db25a2c0 @!"etree!htmlParseEntityRef"
I resumed the execution of my program.
0:002> gI hit Enter in my Python program to make it run through to the end (remember that it was waiting for me to attach to it with a debugger).
The debugger finally broke into the htmlParseStartTag() function.
Then all I needed to do was to use the Step Over (F10), Step In (F11), Step Out (SHIFT+F11) and Go (F5) commands of WinDbg to step through libxml2 and understand what was going on.
Step 3: identifying the problem
After several minutes of stepping through libxml2, I found out that:
- htmlParseStartTag() and htmlParseEntityRef() were doing their job as expected. They were respectively processing new HTML tags and HTML entity references.
- htmlParseName() and htmlParseHTMLName() were most likely not leaking any memory. Anyway, umdh logs were not showing that.
- xmlDictLookup() seemed to cache everything returned by htmlParseName() and htmlParseHTMLName(). I wasn't sure exactly why, but this is what it appeared to be doing.
And it turns out that a few days later, I received a detailed response to my earlier question asked on lxml's mailing list:
As mentioned before, lxml uses a global dict for the names it parses. The
rational is that the sets of names are almost always tiny in comparison to
the number and size of documents. Using one global dict (per thread) rather
than one per document can save a lot of memory and bring a fairly visible
speed-up. It deduplicates the names held in memory across all documents,
which also makes them directly comparable by pointer rather than characters.
This approach can lead to continuous increases in overall memory usage over
time whenever the parser encounters names that it hasn't seen before.
Usually not something to worry about as new names quickly become less
frequent, as long as the number of different document types is bounded.
I don't know how to interpret the numbers at the top of your message, so I
can't say if what you're observing is beyond the level of annoyance or not.
I guess it wouldn't be difficult to provide a global option in lxml to
switch off the dict sharing. This is already done for threads in the class
_ParserDictionaryContext() in parser.pxi. If it annoys you enough, you
could take a look there.
Stefan
AHA! So this totally confirmed what I had found earlier. Every HTML tag, attribute name and entity reference were cached inside a global dictionary which remained in memory during the whole life of the process. According to Stefan Bermel, this provided some speedups for lxml. Some pretty important details to be aware of!
Stefan also pointed out that I could prevent this behavior by modifying _ParserDictionaryContext, the class holding the global dictionary. Sure, I could have done that. But was it really worth it? Especially given that:
- Those two "memory leaks" were not real leaks per se; they were part of the normal behavior of lxml.
- The number of new tags, attributes and entity references would eventually reach a plateau. Indeed, this is what I had observed with my crawler; the rate of unreleased allocations dramatically decreased over time.
- There was a trade-off to be made between memory use and speed with lxml.
- I had spent quite enough time on this - at least for now :)
Final thoughts
So big reversal of situation here!
All those leaks that I had been hunting down in my program were actually values being purposely cached by lxml/libxml2. Sure, a cache that grows without bounds can lead to unreasonable amounts of memory being used. This is why the collect_ids setting was added to the HTMLParser class.
So the next time you suspect that a Python program has a C memory leak on Windows, do the following:
- Use umdh to determine where's the leak.
- Inspect the source code of the library identified by umdh as causing the leak.
- If you're not sure why the leak occurred, ask the community built around the library. There's probably a mailing list or a forum where you can ask questions.
- In the meantime, you can track down the leak using WinDbg or whatever debugger your heart is into4.
The big lesson here is that we should not be scared of debugging open source libraries ourselves. We don't risk anything; all the necessary tools are out there.
But what you? Have you ever used WinDbg to debug a program or track down a memory leak? What are the particular challenges that you met? And did you find this post helpful? If so, please share your comments in the comment section below!
License disclaimer: I don't claim any ownership of code excerpts which were taken directly from lxml's codebase or dependencies. All rights are held by their respective copyright holders. See the license.
Update (19/01/2017): this post was featured in Reddit. It was also featured in the Pycoders Weekly, ImportPython and Awesome Python newsletters. If you get a chance to subscribe to any one of them, you won't be disappointed! Thanks to everyone for your support and your great feedback!
Remember that lxml is a weird mixture of Python and Cython code. Most of its code is written in Cython, though, just like for the HTMLParser class. ↩
Remember that lxml is based on libxml2, a C extension that it statically links to. ↩
This procedure assumes that you've properly installed and set up the Debugging Tools for Windows package. To know how, take a look at my previous blog post. ↩
Alternatively, you could use Visual Studio's debugger if you're more comfortable with it. But personally, I'm enjoying more and more low-level debuggers. So using WinDbg was a no-brainer! ↩