Here I was again, looking at my screen in complete disbelief.
This time, it was different though. My distributed web crawler seemed to be slowing down over time. Adding more nodes only had a temporary performance boost; the overall crawling speed gradually declined afterwards. So simply put, it couldn't scale. But why?
In this post, you'll find out what techniques and tools I used to diagnose scaling issues - and to an extent, more general performance issues - in my Python-based web crawler.
The problem
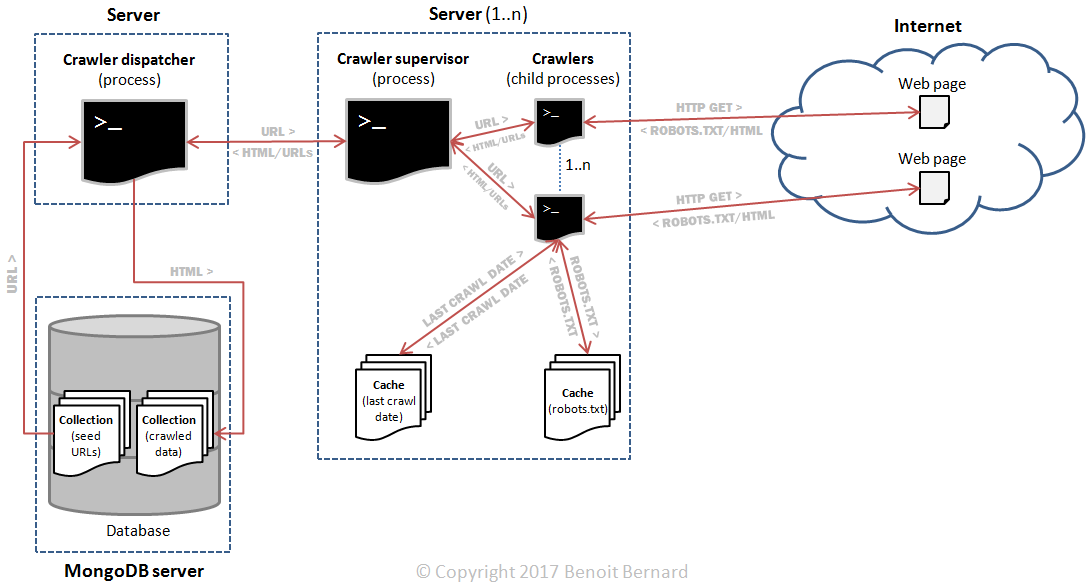
First off, I had designed my crawler as follows:
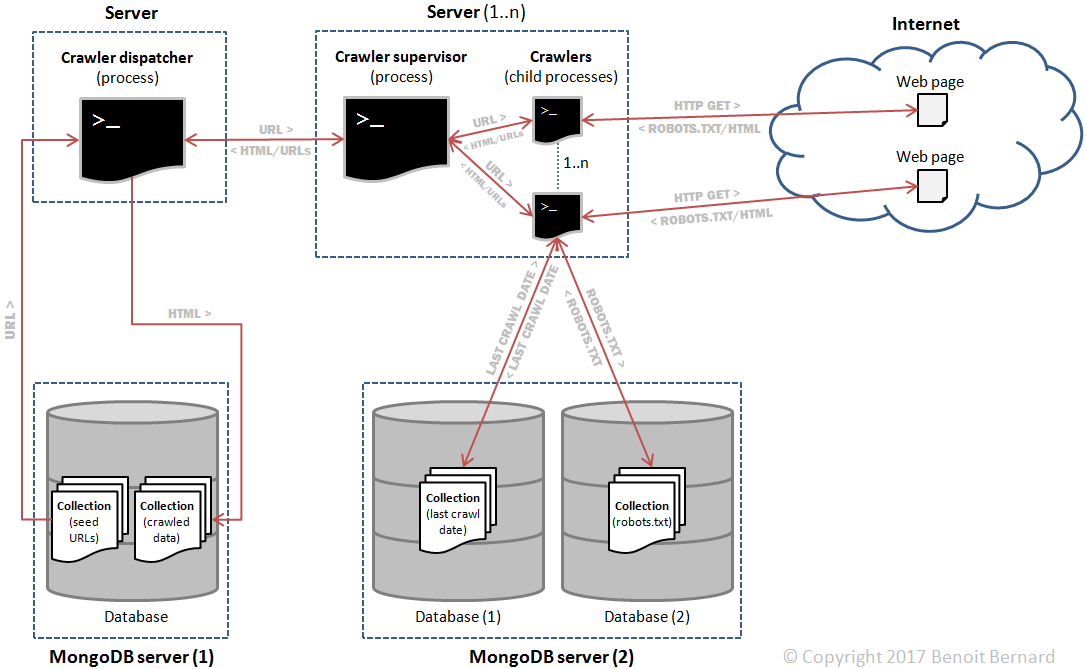
The main components were:
- A crawler dispatcher, responsible for dispatching URLs to be crawled to the N crawler supervisors.
- N crawler supervisors, responsible for supervising N child processes (crawlers). Those child processes performed the actual crawling.
- Two MongoDB servers. The first one stored the initial seed URLs as well as the crawled HTML data; the second one stored robots.txt files and timestamps indicating when a domain was last crawled.
Additionally, all interprocess communications across servers happened thanks to ZeroMQ queues. So in theory, it would be easily scalable. I could add more supervisors and expect performance to increase linearly, or so I thought.
But as crawling was going on, I discovered a curious thing. The overall crawl rate was actually decreasing over time. And I noticed that the effect was even stronger when adding more nodes. Here's an overview with 2 supervisors:
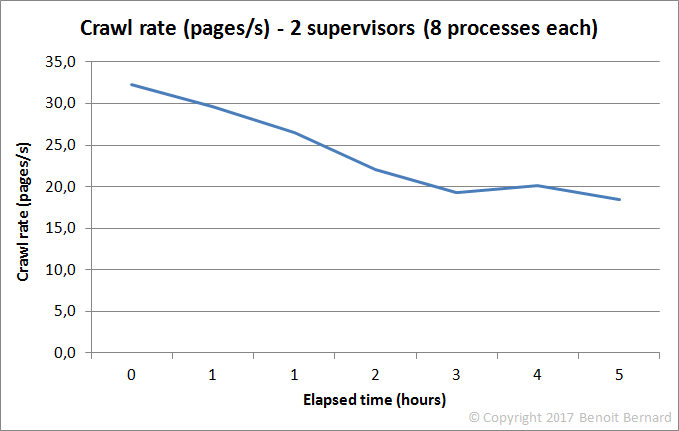
And here's what it looked like with 4 supervisors:
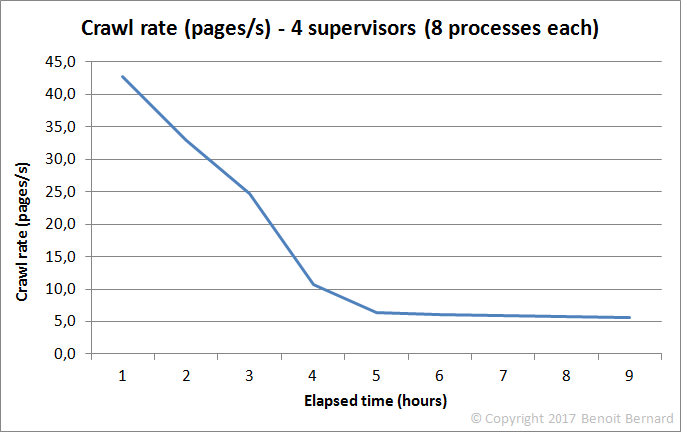
What the hell! There was such a clear trend that it couldn't be just a coincidence. Something was putting the brakes on my crawler. Big time! And I absolutely needed to determine where the bottleneck was. Otherwise, my crawler would be running forever, instead of a few days or weeks.
Attempt #1: Analyzing my application's CPU and memory use
So first of all, I looked at the CPU and memory use of the dispatcher node. Thus, I would know if a lack of resources was a contributing factor.
[acme@dispatcher ~]$ dstat -tcmdsn -N eth0  --top-cpu-adv --top-mem
----system---- ----total-cpu-usage---- ------memory-usage----- -dsk/total- ----swap--- --net/eth0- -------most-expensive-cpu-process------- --most-expensive-
     time     |usr sys idl wai hiq siq| used  buff  cach  free| read  writ| used  free| recv  send|process              pid  cpu read write|  memory process
19-12 20:30:15| 25   4  71   0   0   0| 268M 5644k  197M 18.7M|   0   176k|  34M  466M|  18k   19k|dispatcher           5145  32%8355B 385k|dispatcher 155M
19-12 20:30:16| 22   2  75   0   0   0| 268M 5652k  197M 18.7M|   0    48k|  34M  466M|9622B   18k|dispatcher           5145  26%8013B 340k|dispatcher 155M
19-12 20:30:17| 28   4  68   0   0   0| 268M 5652k  197M 18.7M|   0  4096B|  34M  466M|  12k   21k|dispatcher           5145  34%9983B 283k|dispatcher 155M
19-12 20:30:18| 25   4  71   0   0   0| 268M 5652k  197M 18.7M|   0  4096B|  34M  466M|  15k   14k|dispatcher           5145  29%  21k 303k|dispatcher 155M
19-12 20:30:19| 28   3  68   0   0   1| 268M 5652k  197M 18.7M|   0     0 |  34M  466M|  27k   18k|dispatcher           5145  33%8955B 199k|dispatcher 155M
19-12 20:30:20| 29   4  60   5   0   1| 268M 5652k  197M 18.7M|   0  3800k|  34M  466M|  16k   17k|dispatcher           5145  30%  11k 334k|dispatcher 155M
19-12 20:30:21| 22   5  73   0   0   0| 268M 5660k  197M 18.7M|   0    48k|  34M  466M|  11k   16k|dispatcher           5145  29%  12k 322k|dispatcher 155M
19-12 20:30:22| 24   3  72   0   0   1| 268M 5660k  197M 18.7M|   0     0 |  34M  466M|  13k   15k|dispatcher           5145  28%  12k 245k|dispatcher 155M
19-12 20:30:23| 24   4  72   0   0   0| 268M 5660k  197M 18.7M|   0  4096B|  34M  466M|  10k   15k|dispatcher           5145  28%7097B 315k|dispatcher 155M
19-12 20:30:24| 26   4  71   0   0   0| 268M 5660k  197M 18.7M|   0  4096B|  34M  466M|  15k   18k|dispatcher           5145  32%  12k 320k|dispatcher 155M
...
And here are the same stats for one of the supervisor nodes:
[acme@supervisor-1 ~]$ dstat -tcmdsn -N eth0  --top-cpu-adv --top-mem
----system---- ----total-cpu-usage---- ------memory-usage----- -dsk/total- ----swap--- --net/eth0- -------most-expensive-cpu-process------- --most-expensive-
     time     |usr sys idl wai hiq siq| used  buff  cach  free| read  writ| used  free| recv  send|process              pid  cpu read write|  memory process
20-12 20:33:35|  8   2  90   0   0   0| 466M  296k 15.5M 7956k|   0    40k|  22M  478M|  10k 5357B|crawlers/management/cr2638 9.0% 954B1860B|crawlers/man65.0M
20-12 20:33:36| 13   2  84   0   0   0| 465M  296k 15.5M 7988k|   0     0 |  22M  478M|  15k   10k|crawlers/management/cr2658 9.0%3578B4614B|crawlers/man65.0M
20-12 20:33:37|  7   2  90   0   0   1| 465M  296k 15.5M 7992k|   0     0 |  22M  478M|3761B 3350B|crawlers/management/cr2638 9.0%   8B1945B|crawlers/man65.0M
20-12 20:33:38| 10   3  87   0   0   0| 465M  296k 15.5M 7992k|   0     0 |  22M  478M|5596B   11k|crawlers/management/cr2638 9.0% 115B1454B|crawlers/man65.0M
20-12 20:33:39| 10   2  88   0   0   0| 465M  296k 15.5M 7992k|   0    40k|  22M  478M|6360B 6489B|crawlers/management/cr2638 9.0%   8B1802B|crawlers/man65.0M
20-12 20:33:40| 21   4  74   0   0   0| 466M  304k 15.5M 7812k|   0    44k|  22M  478M|  25k   19k|crawlers/management/cr2658  10%2856B3903B|crawlers/man65.0M
20-12 20:33:41| 39   2  59   0   0   0| 466M  304k 15.5M 7824k|   0     0 |  22M  478M|  55k   19k|crawlers/management/cr2658  18%9145B4954B|crawlers/man65.0M
20-12 20:33:42| 19   3  78   0   0   0| 466M  304k 15.6M 7840k|   0     0 |  22M  478M|  27k   14k|crawlers/management/cr2657  12%4302B4217B|crawlers/man65.0M
20-12 20:33:43| 14   2  84   0   0   0| 466M  304k 15.6M 7784k|   0     0 |  22M  478M|  20k   14k|crawlers/management/cr2638  10%1650B2963B|crawlers/man65.0M
20-12 20:33:44| 24   3  73   0   0   0| 466M  304k 15.6M 7796k|   0     0 |  22M  478M|  56k   11k|crawlers/management/cr2658  17%  37k3771B|crawlers/man65.0M
...
In both cases, the CPU and memory use was under control. So it couldn't explain the slowdown I was observing.
Attempt #2: Analyzing my application's logs
Then I looked at my application's logs1. Analyzing the frequency of appearance of some strategic lines would reveal if any particular operation was slowing down over time.
Here's an excerpt of a log file generated by an individual crawler child process2:
2016-12-20 14:29:19,244 - requests.packages.urllib3.connectionpool - INFO - Starting new HTTP connection (1): www.perdu.com
2016-12-20 14:29:20,086 - requests.packages.urllib3.connectionpool - DEBUG - "GET /robots.txt HTTP/1.1" 200 None
2016-12-20 14:29:20,135 - crawlers.web.multi_worker_web_crawler - DEBUG - The URL 'http://www.perdu.com/' will be crawled.
2016-12-20 14:29:20,136 - crawlers.web.standalone_web_crawler - DEBUG - Crawling URL 'http://www.perdu.com/'.
...
2016-12-20 14:29:22,239 - requests.packages.urllib3.connectionpool - INFO - Starting new HTTP connection (1): www.theansweris42.com
2016-12-20 14:29:23,103 - requests.packages.urllib3.connectionpool - DEBUG - "GET /robots.txt HTTP/1.1" 404 315
2016-12-20 14:29:23,137 - crawlers.web.multi_worker_web_crawler - DEBUG - The URL 'http://www.theansweris42.com/my' will be crawled.
2016-12-20 14:29:23,137 - crawlers.web.standalone_web_crawler - DEBUG - Crawling URL 'http://www.theansweris42.com/my'.
2016-12-20 14:29:23,139 - requests.packages.urllib3.connectionpool - INFO - Starting new HTTP connection (1): www.theansweris42.com
2016-12-20 14:29:24,072 - requests.packages.urllib3.connectionpool - DEBUG - "HEAD /my HTTP/1.1" 404 0
2016-12-20 14:29:24,074 - crawlers.web.standalone_web_crawler - ERROR - Could not retrieve content for URL 'http://www.theansweris42.com/my'.
2016-12-20 14:29:24,099 - crawlers.web.multi_worker_web_crawler - DEBUG - The URL 'http://maddox.xmission.com/' was postponed.
...
2016-12-20 14:29:31,368 - requests.packages.urllib3.connectionpool - INFO - Starting new HTTP connection (1): wikipedia.org
2016-12-20 14:29:31,439 - crawlers.web.throttling.url_action_manager - ERROR - Unable to determine if the URL 'http://wikipedia.org/' is allowed to be crawled.
...
2016-12-20 14:29:31,524 - crawlers.web.multi_worker_web_crawler - DEBUG - The URL 'http://wikipedia.org/' was ignored.
Based on the above, I knew:
- Which URLs had been crawled, ignored or postponed, depending on the action determined from robots.txt (lines 3, 8, 13 and 18).
- That robots.txt was properly downloaded for each domain (lines 2 and 7).
But I found that the granularity of my logs wasn't great, quite frankly. For example, I didn't log anything when querying MongoDB server #2 - despite it playing a huge role in the crawling. Not logging enough is one of the great sins awaiting any neglectful programmer.
So I was left with a far-from-perfect option. I could calculate the average delay between lines containing 'will be crawled'. This would be a good starting point - at least to confirm that crawling was slowing down locally for individual crawler child processes.
To do that, I wrote this very simple Python script:
# Copyright 2016-2017 Benoit Bernard All Rights Reserved.
#
# Licensed under the Apache License, Version 2.0 (the "License");
# you may not use this file except in compliance with the License.
# You may obtain a copy of the License at
#
#     http://www.apache.org/licenses/LICENSE-2.0
#
# Unless required by applicable law or agreed to in writing, software
# distributed under the License is distributed on an "AS IS" BASIS,
# WITHOUT WARRANTIES OR CONDITIONS OF ANY KIND, either express or implied.
# See the License for the specific language governing permissions and
# limitations under the License.
"""
Module containing a log analyzer capable of providing stats about log files.
"""
import sys
from argparse import ArgumentParser
from core.conversion import datetime_converter
_SEPARATOR = " - "
_TIMESTAMP_FORMAT = "%Y-%m-%d %H:%M:%S,%f"
_NY_TIMEZONE = "America/New_York"
def analyze_log(filename, timezone):
    seconds_array = []
    with open(filename, encoding="utf-8") as file:
        last_url_crawled_datetime_as_utc = None
        for line in file:
            parts = line.split(_SEPARATOR)
            if len(parts) == 4:
                message = parts[3]
                if "will be crawled" in message:
                    url_crawled_datetime_as_utc = datetime_converter.from_string(parts[0], format_str=_TIMESTAMP_FORMAT, timezone_str=timezone)
                    if last_url_crawled_datetime_as_utc is not None:
                        seconds_between_crawled_urls = (url_crawled_datetime_as_utc - last_url_crawled_datetime_as_utc).total_seconds()
                        seconds_array.append(seconds_between_crawled_urls)
                    last_url_crawled_datetime_as_utc = url_crawled_datetime_as_utc
    if len(seconds_array) > 0:
        print("Average of {0} seconds between crawled URLs.".format(sum(seconds_array) / len(seconds_array)))
    else:
        print("No URL crawled in log file.")
if __name__ == "__main__":
    argument_parser = ArgumentParser(description="Log analyzer.")
    argument_parser.add_argument("--filename", dest="filename", action="store", type=str, required=True, help="The full path of the log file.")
    argument_parser.add_argument("--timezone", dest="timezone", action="store", type=str, required=False, default=_NY_TIMEZONE, help="The timezone associated with timestamps.")
    parsed_args = argument_parser.parse_args(sys.argv[1:])
    analyze_log(parsed_args.filename, parsed_args.timezone)
And I ran it over two consecutive log files generated by a specific crawler's child process:
C:\Users\acme\Documents\crawler\env\Scripts\python.exe G:/crawler/tools/log_analyzer.py --filename "C:\tmp\downloaded data\logs\supervisor-1\static_supervisor.log13468.2"
Average of 2.8193854052071856 seconds between crawled URLs.
C:\Users\acme\Documents\crawler\env\Scripts\python.exe G:/crawler/tools/log_analyzer.py --filename "C:\tmp\downloaded data\logs\supervisor-1\static_supervisor.log13468"
Average of 5.63948148148148 seconds between crawled URLs.
The delay between two crawled URLs had gone from 2.8 to 5.6 seconds, over a period of roughly 6 hours. A slowdown factor of 2X! Yikes! And if you're wondering - I was seeing the exact same phenomenon on the other supervisor nodes. And it was showing no sign of an eventual improvement.
So there was a slowdown, and I knew by how much. But what part of my code was to blame?
Attempt #3: Using the Pyflame profiler
My crawler had been running for several hours now, and it was currently exhibiting the slowdown effect. So stopping it to add a bit more of logging was out of question. "Why not use a profiler?", I told myself.
My requirements were clear:
- To be able to profile an already running process/service.
- To not tamper with the already poor crawling performance.
- To be able to identify precisely the performance bottlenecks in the code.
- To be callable from a Linux shell (CentOS 7.X).
- To be free, ideally!
There were not that many options out there, as I found out by googling around. My quest ended with Pyflame, a C-based Python profiler developed by Evan Klitzke of Uber. Based on its documentation alone, it seemed quite awesome. Also, profiling results could be displayed as flame graphs. Pretty cool!
But apparently, nobody had yet documented their experience of using this profiler. So yeah, this time, I would be a pioneer!
Step 1: Installing Pyflame's dependencies3
[acme@supervisor-1 ~]$ sudo yum install autoconf automake gcc-c++ python-devel
Loaded plugins: fastestmirror
Repodata is over 2 weeks old. Install yum-cron? Or run: yum makecache fast
base                                                     | 3.6 kB     00:00
epel/x86_64/metalink                                     |  13 kB     00:00
epel                                                     | 4.3 kB     00:00
extras                                                   | 3.4 kB     00:00
google-chrome                                            |  951 B     00:00
updates                                                  | 3.4 kB     00:00
(1/5): extras/7/x86_64/primary_db                          | 166 kB   00:01
(2/5): epel/x86_64/group_gz                                | 170 kB   00:01
(3/5): epel/x86_64/updateinfo                              | 668 kB   00:01
(4/5): epel/x86_64/primary_db                              | 4.3 MB   00:02
(5/5): updates/7/x86_64/primary_db                         | 8.4 MB   00:01
google-chrome/primary                                      | 2.0 kB   00:00
Determining fastest mirrors
 * base: mirror.trouble-free.net
 * epel: mirror.cs.princeton.edu
 * extras: mirrors.rit.edu
 * updates: mirror.vcu.edu
...
Complete!
Step 2: Cloning Pyflame's repository and checking its content
[acme@supervisor-1 ~]$ mkdir pyflame
[acme@supervisor-1 ~]$ git clone https://github.com/uber/pyflame pyflame
Cloning into 'pyflame'...
remote: Counting objects: 440, done.
remote: Total 440 (delta 0), reused 0 (delta 0), pack-reused 440
Receiving objects: 100% (440/440), 96.91 KiB | 0 bytes/s, done.
Resolving deltas: 100% (269/269), done.
[acme@supervisor-1 ~]$ cd pyflame/
[acme@supervisor-1 pyflame]$ ls -l
total 68
-rwxrwxr-x 1 acme acme    31 Dec 20 21:17 autogen.sh
-rw-rw-r-- 1 acme acme  1556 Dec 20 21:17 configure.ac
drwxrwxr-x 3 acme acme  4096 Dec 20 21:17 debian
-rw-rw-r-- 1 acme acme 10174 Dec 20 21:17 LICENSE
drwxrwxr-x 2 acme acme  4096 Dec 20 21:17 m4
-rw-rw-r-- 1 acme acme   166 Dec 20 21:17 Makefile.am
-rw-rw-r-- 1 acme acme  1438 Dec 20 21:17 pyflame.man
-rw-rw-r-- 1 acme acme  9608 Dec 20 21:17 README.md
-rw-rw-r-- 1 acme acme   319 Dec 20 21:17 runtests.sh
drwxrwxr-x 2 acme acme  4096 Dec 20 21:17 src
drwxrwxr-x 2 acme acme  4096 Dec 20 21:17 tests
drwxrwxr-x 2 acme acme  4096 Dec 20 21:17 travis
drwxrwxr-x 2 acme acme  4096 Dec 20 21:17 utils
Step 3: Setting up Python 3
Due to my particular environment4, I had to tweak things a little bit so that 'python3' would be recognized as a valid library.
[acme@supervisor-1 pyflame]$ pkg-config --cflags --libs python3
Package python3 was not found in the pkg-config search path.
Perhaps you should add the directory containing `python3.pc'
to the PKG_CONFIG_PATH environment variable
No package 'python3' found
[acme@supervisor-1 lib]$ export PKG_CONFIG_PATH=/usr/bin:/home/acme/Python-3.3.6/Misc
[acme@supervisor-1 lib]$ ln -s /home/acme/Python-3.3.6/Misc/python.pc /home/acme/Python-3.3.6/Misc/python3.pc
[acme@supervisor-1 lib]$ ls -l /home/acme/Python-3.3.6/Misc/python3.pc
lrwxrwxrwx 1 acme acme 38 Dec 30 21:28 /home/acme/Python-3.3.6/Misc/python3.pc -> /home/acme/Python-3.3.6/Misc/python.pc
[acme@supervisor-1 lib]$ pkg-config --cflags --libs python3
-I/usr/local/include/python3.3m  -L/usr/local/lib -lpython3.3m
Step 4: Compiling and installing Pyflame
[acme@supervisor-1 pyflame]$ ./autogen.sh
configure.ac:8: installing 'build-aux/install-sh'
configure.ac:8: installing 'build-aux/missing'
src/Makefile.am: installing 'build-aux/depcomp'
[acme@supervisor-1 lib]$ cd ~/pyflame
[acme@supervisor-1 pyflame]$ ./configure --with-python=python3
checking for a BSD-compatible install... /usr/bin/install -c
checking whether build environment is sane... yes
checking for a thread-safe mkdir -p... /usr/bin/mkdir -p
checking for gawk... gawk
checking whether make sets $(MAKE)... yes
...
configure: creating ./config.status
config.status: creating Makefile
config.status: creating src/Makefile
config.status: creating src/config.h
config.status: executing depfiles commands
[acme@supervisor-1 pyflame]$ make
Making all in src
make[1]: Entering directory `/home/acme/pyflame/src'
make  all-am
make[2]: Entering directory `/home/acme/pyflame/src'
g++ -DHAVE_CONFIG_H -I.    -I/usr/local/include/python3.3m...
...
make[2]: Leaving directory `/home/acme/pyflame/src'
make[1]: Leaving directory `/home/acme/pyflame/src'
make[1]: Entering directory `/home/acme/pyflame'
make[1]: Nothing to be done for `all-am'.
make[1]: Leaving directory `/home/acme/pyflame'
[acme@supervisor-1 pyflame]$ sudo make install
[sudo] password for acme:
[acme@supervisor-1 pyflame]$ find . -name "pyflame"
./src/pyflame
[acme@supervisor-1 pyflame]$ ls ./src/pyflame
./src/pyflame
[acme@supervisor-1 pyflame]$ ls ./src/pyflame -l
-rwxrwxr-x 1 acme acme 797159 Dec 20 21:31 ./src/pyflame
Step 5: Testing out Pyflame
[acme@supervisor-1 pyflame]$ ./src/pyflame
Usage: pyflame [options] <pid>
       pyflame [-t|--trace] command arg1 arg2...
General Options:
  -h, --help           Show help
  -s, --seconds=SECS   How many seconds to run for (default 1)
  -r, --rate=RATE      Sample rate, as a fractional value of seconds (default 0.001)
  -t, --trace          Trace a child process
  -T, --timestamp      Include timestamps for each stacktrace
  -v, --version        Show the version
  -x, --exclude-idle   Exclude idle time from statistics
Step 6: Installing flamegraph.pl
First of all, I made sure that Perl was properly installed.
[acme@supervisor-1 pyflame]$ perl -v
This is perl 5, version 16, subversion 3 (v5.16.3) built for x86_64-linux-thread-multi
(with 29 registered patches, see perl -V for more detail)
Copyright 1987-2012, Larry Wall
...
Then, I downloaded flamegraph.pl.
[acme@supervisor-1 pyflame]$ wget https://raw.githubusercontent.com/brendangregg/FlameGraph/master/flamegraph.pl
--2016-12-20 21:36:16--  https://raw.githubusercontent.com/brendangregg/FlameGraph/master/flamegraph.pl
Resolving raw.githubusercontent.com (raw.githubusercontent.com)... 151.101.32.133
Connecting to raw.githubusercontent.com (raw.githubusercontent.com)|151.101.32.133|:443... connected.
HTTP request sent, awaiting response... 200 OK
Length: 31933 (31K) [text/plain]
Saving to: ‘flamegraph.pl’
100%[======================================>] 31,933      --.-K/s   in 0.008s
2016-12-20 21:36:16 (3.93 MB/s) - ‘flamegraph.pl’ saved [31933/31933]
Finally, I set the necessary execution permission on flamegraph.pl5:
[acme@supervisor-1 pyflame]$ ls -l flamegraph.pl
-rw-rw-r-- 1 acme acme 31933 Dec 20 21:36 flamegraph.pl
[acme@supervisor-1 pyflame]$ chmod 764 flamegraph.pl
[acme@supervisor-1 pyflame]$ ls -l flamegraph.pl
-rwxrw-r-- 1 acme acme 31933 Dec 20 21:36 flamegraph.pl
Step 7: Profiling the crawler
On the supervisor node, I retrieved the status of the main service, so I could see the IDs of all of its child processes (crawlers).
[acme@supervisor-1 pyflame]$ sudo systemctl status supervisor-node.service -l
● supervisor-node.service - Service to control a crawler node
   Loaded: loaded (/etc/systemd/system/supervisor-node.service; enabled; vendor preset: disabled)
   Active: active (running) since Tue 2016-12-20 14:28:33 EDT; 7h ago
 Main PID: 8389 (python)
   CGroup: /system.slice/supervisor-node.service
           ├─8389 /home/acme/crawler/env/bin/python crawlers/management/crawler_supervisor.py --config data/crawler_supervisor_config_with_static_crawler.json
           ├─8403 /home/acme/crawler/env/bin/python crawlers/management/crawler_supervisor.py --config data/crawler_supervisor_config_with_static_crawler.json
           ├─8404 /home/acme/crawler/env/bin/python crawlers/management/crawler_supervisor.py --config data/crawler_supervisor_config_with_static_crawler.json
           ├─8405 /home/acme/crawler/env/bin/python crawlers/management/crawler_supervisor.py --config data/crawler_supervisor_config_with_static_crawler.json
           ├─8406 /home/acme/crawler/env/bin/python crawlers/management/crawler_supervisor.py --config data/crawler_supervisor_config_with_static_crawler.json
           ├─8407 /home/acme/crawler/env/bin/python crawlers/management/crawler_supervisor.py --config data/crawler_supervisor_config_with_static_crawler.json
           ├─8408 /home/acme/crawler/env/bin/python crawlers/management/crawler_supervisor.py --config data/crawler_supervisor_config_with_static_crawler.json
           ├─8409 /home/acme/crawler/env/bin/python crawlers/management/crawler_supervisor.py --config data/crawler_supervisor_config_with_static_crawler.json
           └─8410 /home/acme/crawler/env/bin/python crawlers/management/crawler_supervisor.py --config data/crawler_supervisor_config_with_static_crawler.json
Then, I profiled the child process with ID 8403 for 600 seconds6, with the default sampling frequency (1 millisecond):
[acme@supervisor-1 pyflame]$ ./src/pyflame -s 600 8403 | ./flamegraph.pl > child_process_profiling_1.svg
Surprisingly enough, this is what I saw when I opened the SVG file in Google Chrome:

Update (06/06/2017): as pointed out by a commenter below, Pyflame now features a --threads option that allows you to see inside idle time. Though I haven't tested it, it will most likely prevent you from getting the "empty flame graph" issue described here.
Hum... what?! Pyflame had collected more than 414K samples, and it contained more than 99% idle time. How could it even be possible? Either Pyflame had a bug, or my crawler effectively remained idle most of the time.
Let's suppose that Pyflame was not entirely at fault here. I figured that if I could suppress all the idle time shown in the flame graph, then I could see where the process was spending the rest of its time. Fortunately, Pyflame has an argument to exclude idle time, that is -x.
So this time, I ran the profiler for a little bit longer (1200 seconds) with a higher sampling frequency (10 microseconds)7 8 and I excluded idle time.
[acme@supervisor-1 pyflame]$ ./src/pyflame -s 1200 -r 0.00001 -x 8403 | ./flamegraph.pl > child_process_profiling_2.svg
Finally, I opened the resulting SVG:
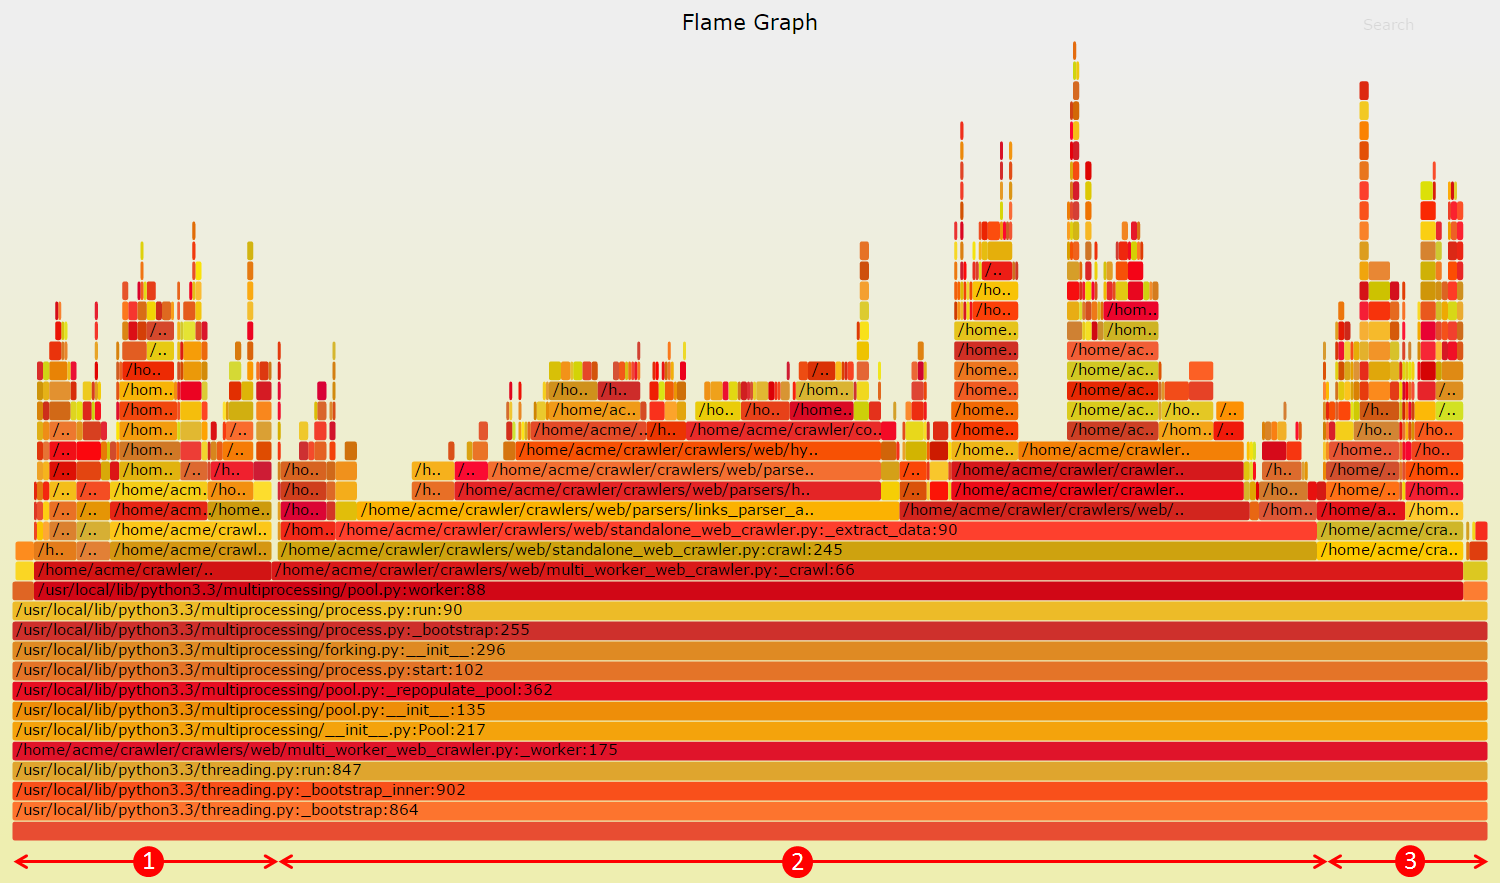
Very cool! So in a flame graph, the horizontal axis represents the total number of samples collected. So the larger the area, the more time has been spent executing the associated function.
And the vertical axis represents the depth of the call stack. So the higher the peak, the deeper the call stack. Colors don't represent anything specific; they're just there to make a visual contrast.
So there were 3 major sections in the graph:
- Queries made to MongoDB server #2 (robots.txt and last crawl timestamp caches).
- Parsing of hyperlinks from crawled web pages.
- HTTP requests made to download web pages.
Clearly, 2 and 3 couldn't realistically be slowing down over time - or at least, not in the way it did. So I was left with 1; the bottleneck most likely came from MongoDB server #2. But I couldn't be 100% sure about that. Precisely because Pyflame had trouble detailing idle time, as well as showing from which calls it had originated9. Yet, this was my best bet.
Attempt #4: Analyzing MongoDB's CPU use and logs
MongoDB server #2 was the most likely culprit. So what did its CPU use look like?
[mongo@mongo-2 ~]$ dstat -tcmdsn -N eth0  --top-cpu-adv --top-mem
----system---- ----total-cpu-usage---- ------memory-usage----- -dsk/total- ----swap--- --net/eth0- -------most-expensive-cpu-process------- --most-expensive-
     time     |usr sys idl wai hiq siq| used  buff  cach  free| read  writ| used  free| recv  send|process              pid  cpu read write|  memory process
12-20 21:50:09| 99   1   0   0   0   0| 459M  980k 22.6M 6776k|   0    20k|  65M  959M|1982B 3759B|mongod               806   98%   0    0 |mongod       393M
12-20 21:50:10|100   0   0   0   0   0| 459M  980k 22.7M 6776k|   0  8192B|  65M  959M|2243B 3856B|mongod               806   99%   0    0 |mongod       393M
12-20 21:50:11| 99   1   0   0   0   0| 459M  980k 22.7M 6776k|   0    12k|  65M  959M|7269B 4445B|mongod               806   98%   0    0 |mongod       393M
12-20 21:50:12|100   0   0   0   0   0| 459M  988k 22.7M 6776k|   0    40k|  65M  959M|4136B 5572B|mongod               806  101%   0    0 |mongod       393M
12-20 21:50:13|100   0   0   0   0   0| 459M  988k 22.7M 6776k|   0  8192B|  65M  959M|4655B 3357B|mongod               806   98%   0    0 |mongod       393M
12-20 21:50:14| 99   1   0   0   0   0| 459M  988k 22.7M 6776k|   0  4096B|  65M  959M|2866B 3319B|mongod               806   99%   0    0 |mongod       393M
12-20 21:50:15|100   0   0   0   0   0| 459M  996k 22.7M 6744k|   0    36k|  65M  959M|6032B 5595B|mongod               806   99%   0    0 |mongod       393M
12-20 21:50:16|100   0   0   0   0   0| 459M  996k 22.7M 6776k|   0  8192B|  65M  959M|2550B 1969B|mongod               806   98%   0    0 |mongod       393M
12-20 21:50:17| 99   1   0   0   0   0| 459M 1004k 22.7M 6776k|   0    24k|  65M  959M|3304B 3177B|mongod               806  100%   0    0 |mongod       393M
12-20 21:50:18|100   0   0   0   0   0| 459M 1004k 22.7M 6652k|   0    36k|  65M  959M|3499B 3208B|mongod               806   99%   0    0 |mongod       393M
Whoa! The mongod process - that is, the main process of MongoDB - was using 100% of the CPU. This was in contrast to what I had observed earlier.
So I took a look at the MongoDB logs to gain some insight into the problem. I was mainly interested in lines showing the actual queries performed by the crawler processes, such as these:
2016-12-20T20:24:19.282-0500 I COMMAND  [conn637] command database2.robots command: find { find: "robots", filter: { key: "casey.ryback.com" }, limit: 1, singleBatch: true } planSummary: COLLSCAN keysExamined:0 docsExamined:99041 cursorExhausted:1 keyUpdates:0 writeConflicts:0 numYields:777 nreturned:0 reslen:118 locks:{ Global: { acquireCount: { r: 1556 } }, Database: { acquireCount: { r: 778 } }, Collection: { acquireCount: { r: 778 } } } protocol:op_query 530ms
2016-12-20T20:24:19.308-0500 I COMMAND  [conn643] command database1.last_crawl_date command: find { find: "last_crawl_date", filter: { key: "www.bananajoe.com" }, limit: 1, singleBatch: true } planSummary: COLLSCAN keysExamined:0 docsExamined:76099 cursorExhausted:1 keyUpdates:0 writeConflicts:0 numYields:595 nreturned:0 reslen:139 locks:{ Global: { acquireCount: { r: 1192 } }, Database: { acquireCount: { r: 596 } }, Collection: { acquireCount: { r: 596 } } } protocol:op_query 277ms
Both of these queries were of type db.collection.find(), and this is what they did10:
- The first one asked for the robots.txt associated with the casey.ryback.com domain name (database2.robots collection). The query completed in 530 ms.
- The second one asked for the last crawl date associated with the www.bananajoe.com domain name (database1.last_crawl_date collection). The query completed in 277 ms.
These queries had executed quite slowly, based on their execution times. So what if all queries had been slowing down over time? To validate this, I wrote a script that extracts all the execution times of db.collection.find() queries associated with the database2.robots collection. Then I was able to chart the data:
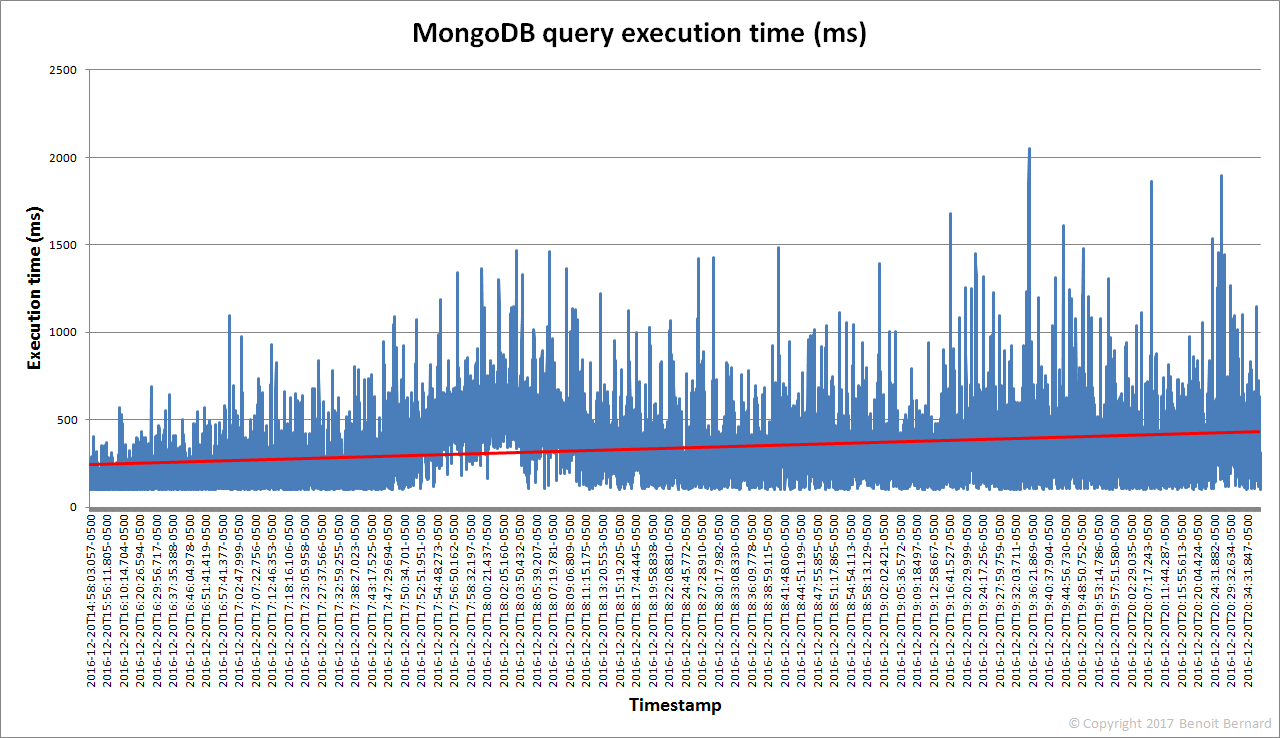
Gotcha! The trendline (in red) confirmed exactly what I was thinking. The query execution time had almost doubled over roughly 6 hours. This meant that the MongoDB server was barely able to keep up with the query load. It was literally being bombarded with queries coming from the various crawler processes. And this had a dramatic effect on the overall crawling speed, as observed earlier. This thus prevented any scalability.
The solution
Update (17/03/2017): Thanks to the great folks at MongoDB and Vivint for pointing out that the real problem was... a missing database index. Yep, this kind of thing happens. So the design that follows is still valid and would be better for a very large-scale deployment of my crawler. But it would probably be overkill in the current state of things. Fortunately, I haven't implemented the changes yet :)
I saw at least two possible solutions:
- Improve the performance of MongoDB server #2, either by tweaking its configuration settings, upgrading its hardware or using sharding.
- Replace MongoDB server #2 with caches stored locally for each crawler process.
The first solution seemed like putting a plaster on a wound. Sure, I would certainly have seen an immediate boost in the overall crawling speed. But as I would have added even more supervisor nodes - and consequently, more crawler processes - the exact same scalability issue would come back. After all, everybody was fighting for the database.
The second solution was the harder, but obviously sounder choice. You may wonder why I didn't design the crawler that way right from the start. Well, scaling was not my focus initially, and I didn't see this project as becoming so huge. I guess that this is a common problem of all web crawler projects; their complexity is often underestimated. Additionally, I thought that MongoDB would be able to sustain the query load with as few as 2, 3 or 4 supervisor nodes - but I was evidently wrong.
So now, the latter implied a few important architecture changes:
To summarize:
- On each supervisor node, each crawler process would have its own robots.txt and last_crawl_date caches; this would replace the centralized cache (MongoDB server #2).
- Due to this, the dispatcher would need to dispatch each URL to a very specific supervisor node.
- Upon receiving a new URL to crawl, a supervisor node would need to dispatch it to a very specific crawler process. Otherwise, multiple processes across different supervisors might crawl the exact same website at the same time. My crawler might then be banned, because it wouldn't be honoring the rules of robots.txt.
Fortunately, ZeroMQ supports prefix matching, so I could route a URL to a specific supervisor node based on its domain name. And I had already coded a persistent cache, mainly based on SQLite. So I could definitely reuse it to prevent individual caches from using too much memory. Adding a bit more logging to my code would also be a good idea. Alright!
Now, this looked all cute and nice on paper. But would it really allow me to scale my crawler, say to dozens of nodes? This is what you'll find out in a future blog post!
Final thoughts
In this post, we've seen how I was able to diagnose a scaling issue in my Python-based web crawler. But you could apply the same methodology to any long-running Python program:
- Use logging extensively in your program to see its control flow and evaluate timings associated with each operation that it does.
- If the granularity of your logs isn't enough, then use a profiler to determine where the performance hotspots are. Many profilers exist; personally, I chose Pyflame based on my requirements.
- If you identify an external server (e.g. database) as the bottleneck, then carefully analyze its CPU use and logs to determine what the possible causes are.
Now, I'd be curious to know about you! Have you ever diagnosed performance issues in your Python programs? If so, what tools did you use? And were you successful with them? Please leave a comment in the comment section below!
Update (23/02/2017): this post was featured in Reddit. It was also featured in the Pycoders Weekly, Awesome Python, Python Weekly and ImportPython newsletters. If you get a chance to subscribe to any one of them, you won't be disappointed! Thanks to everyone for your support and your great feedback!
My application's logs were generated thanks to the logging module. ↩
The URLs in this post were obfuscated for privacy purposes. ↩
In these steps, I mostly followed the installation instructions given in the documentation. But I had to make a few important tweaks, due to my particular environment (CentOS 7.X). ↩
This step was required because: 1) I was using a specific version of Python (3.3.6), installed in a custom location. This required a bit of tweaking to make the compilation work. 2) There's no python3-dev/python3-devel package for my specific Python and CentOS versions. This is contrary to Debian-based Linux distributions. As per the explanations on Ubuntu Forums and StackOverflow, we could expect to find a Python 3.3.X development package for CentOS 7.X. But there's none. ↩
This permission is required because flamegraph.pl runs as an executable. ↩
By default, Pyflame runs for only 1 second, so you'll most likely need to set the sampling time yourself (using the -s option). ↩
By default, the sampling frequency is 1 millisecond. You may need to adjust it based on your own needs. If your program essentially waits all the time, you may end up with an empty flamegraph (i.e. showing only "idle" time). ↩
flamegraph.pl may return the error "no stack counts found". This happens when Pyflame outputs nothing. So make sure that the sampling frequency is high enough. ↩
I further found out that there are two bugs opened specifically to resolve this "idle detailization". See issue #41 and issue #13. ↩
The MongoDB's log message format is documented, but not entirely. You need to search in the documentation a little bit to figure out the meaning of specific fields. ↩