"I thought that memory leaks were impossible in Python?", I said to myself, staring incredulously at my screen.
It was 8:00 PM. The memory use of my crawler was slowly, but steadily increasing. As I hadn't changed any significant portion of my code, this made no sense at all. Had I introduced a new bug? If so, where was it?
Here follows the full story of how I tracked down a memory leak in my Python application.
The symptoms
So after a few minutes of crawling, the just-enough-paranoid programmer in me took a quick glance at the Windows Task Manager1.

The memory use of the Python process seemed to be under control. But just a few seconds later, I realized that it was slowly increasing.
A bunch of questions immediately came to my mind:
- Was memory use really increasing?
- If yes, at what pace?
- And would it eventually stabilize?
I clearly needed a more reliable way to validate this.
Monitoring memory using Performance Monitor
To track the memory allocated by my Python process, I turned to Performance Monitor2.
Here's what I did:
- I launched Performance Monitor (perfmon.msc).
- I created a new Data Collector Set and added the Process > Private Bytes counter for all Python instances3.
- I started the Data Collector Set.
- I let Performance Monitor collect data for several minutes4.
- I exported the data contained in the generated report to a CSV file.
- I opened the CSV file in Excel and created a chart for the process that I suspected had the memory leak:
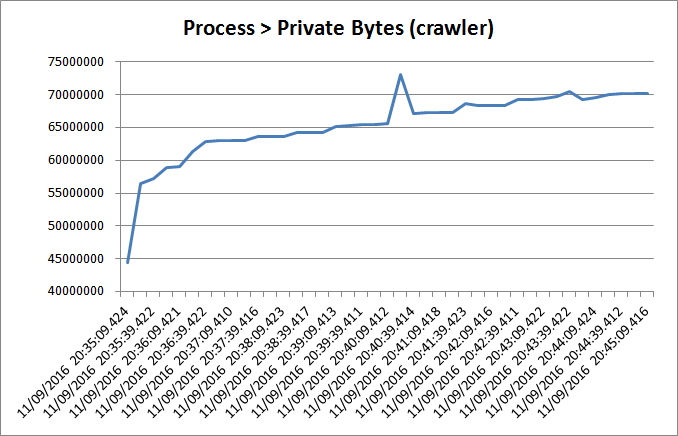
The overall trend was an increase in allocated memory over time. So I had to dig deeper, as this was typical of memory leaks.
Visualizing allocated objects using Python Object Graphs (objgraph)
The more Python objects you create and keep alive, the more memory you consume.
This is why I turned to objgraph, a very cool Python library capable of enumerating all objects allocated by a Python process. But that's not all. It also allows you to draw object reference graphs! Awesome!
So here's what I did:
In a new command prompt, I activated my Python virtual environment5.
G:\>cd crawler
G:\crawler>env\Scripts\activate.bat
I installed objgraph:
(env) G:\crawler>pip install objgraph
Collecting objgraph
  Downloading objgraph-3.0.1.tar.gz (628kB)
    100% |################################| 634kB 441kB/s
Building wheels for collected packages: objgraph
  Running setup.py bdist_wheel for objgraph ... done
  Stored in directory: C:\Users\acme\AppData\Local\pip\Cache\wheels\29\af\5f\7
47abda0832204bc38f1756f0938c87de96561ee401771fb7c
Successfully built objgraph
Installing collected packages: objgraph
Successfully installed objgraph-3.0.1
I installed graphviz, which is a requirement of objgraph.
I launched PyCharm6 and I attached to one of the leaking processes (Run > Attach to Local Process...). This is what I saw in the Console tab:
Attaching to a process with PID=11452
C:\Users\acme\Documents\crawler\env\Scripts\python.exe "C:\Program Files (x86)\JetBrains\PyCharm Community Edition 2016.2.1\helpers\pydev\pydevd_attach_to_process\attach_pydevd.py" --port 55534 --pid 11452
Connecting to 64 bits target
Injecting dll
Dll injected
Allocating code in target process
Writing code in target process
Allocating return value memory in target process
Injecting code to target process
Waiting for code to complete
Connected to pydev debugger (build 162.1812.1)
Attach finished successfully.
I paused the Python program by clicking on the Pause Program button in the Debug window. The debugger eventually broke into my program at a specific line.
- In the Debug window, under the Console tab, I clicked on the Show Python Prompt button, which would allow me to execute Python code in the scope of my program.
In the Python prompt, I used objgraph to display the most common object types in memory. I saw that two of these object types were from my own code (i.e. Hyperlink and UrlPattern). However, I couldn't draw any outright conclusion, as I didn't know how the number of such instances had increased over time.
>>> import objgraph
>>> objgraph.show_most_common_types(limit=50)
function                   9178
dict                       5298
list                       5017
tuple                      4252
weakref                    2460
Hyperlink                  1892
...
_HashedSeq                 137
classmethod                120
_LogEntry                  118
FileFinder                 103
itemgetter                 97
MovedAttribute             92
UrlPattern                 81
MovedModule                75
...
So I resumed the execution of my program by clicking on the Resume Program button.
A few minutes later, I paused the program once again and displayed the most common object types in memory7. This is when I saw that the number of Hyperlink objects had dramatically increased by more than 500. "Hyperlink is clearly a problem.", I assumed.
>>> import objgraph
>>> objgraph.show_most_common_types(limit=50)
function                   9209
dict                       5353
list                       5246
tuple                      4098
weakref                    2465
Hyperlink                  2419
...
_HashedSeq                 137
classmethod                120
FileFinder                 103
_LogEntry                  101
itemgetter                 97
MovedAttribute             92
UrlPattern                 81
MovedModule                75
...
Finally, I generated an object reference graph for an arbitrary Hyperlink object and I opened the associated PNG file8.
>>> obj = objgraph.by_type('Hyperlink')[1000]
>>> objgraph.show_backrefs(obj, max_depth=10)
Graph written to c:\users\acme\appdata\local\temp\objgraph-c5kwsw.dot (63 nodes)
Graph viewer (xdot) not found, generating a png instead
Image generated as c:\users\acme\appdata\local\temp\objgraph-c5kwsw.png
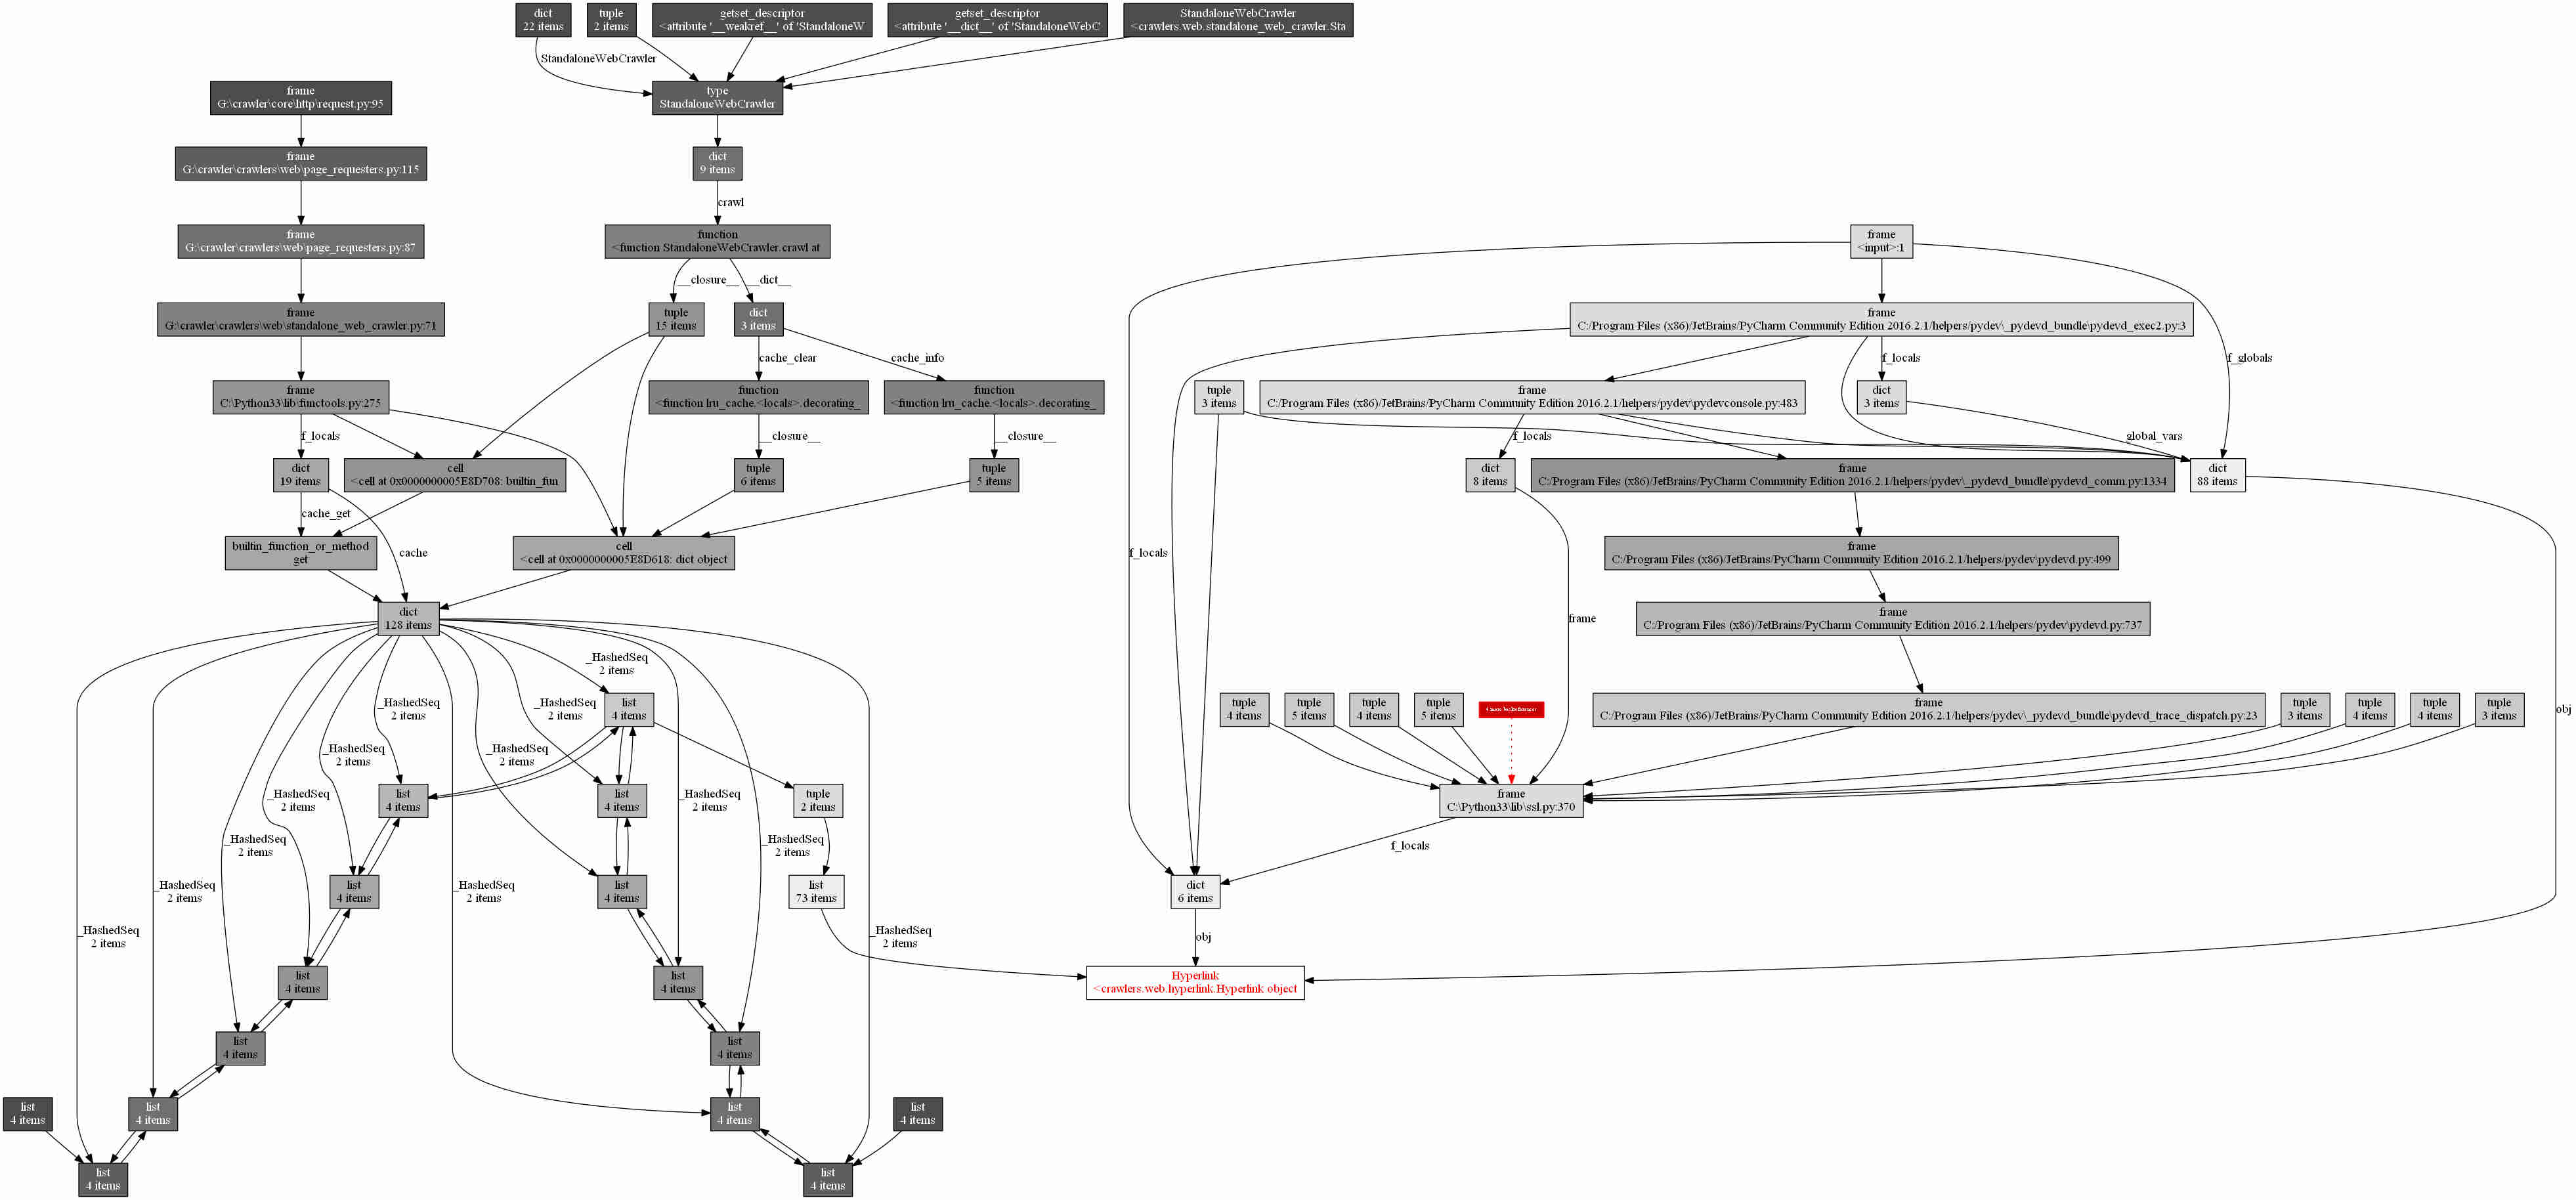
Oh my! Do you see the complexity of that monster? Sure, it was telling me that a bunch of objects were referencing that particular Hyperlink instance (in red). But it's kind of overwhelming, isn't it?
A potentially troublesome decorator: @functools.lru_cache()
So I stepped back a little bit, and tried to decipher the previous graph:
- On the right-hand side of the graph, there are a whole hierarchy of objects referencing the Hyperlink object. They're clearly related to the internals of PyCharm, not my code.
- On the left-hand side of the graph:
- An object of type _HashedSeq is referencing the Hyperlink object.
- An object of type dict is referencing the _HashedSeq object.
- And then a whole hierarchy of objects is referencing the dict, up to a few function objects at the top. They're related to my own code (StandaloneWebCrawler.crawl()) and to some Least Recently Used cache (lru_cache).
This last bit was interesting. I had recently added the @functools.lru_cache decorator to one of my methods to avoid recrawling the same URLs twice. But could it really leak more than 2000 Hyperlink objects? I was quite sceptical.
And as I looked at my code, there was nothing particularly striking. I seemed to be using the lru_cache decorator in the most basic way possible.
class StandaloneWebCrawler:
    ...
    @functools.lru_cache()
    def crawl(self, hyperlink):
        ...
So I searched a bit on the web and found this rather puzzling bug report. On one hand, the reporter said that the lru_cache decorator might cause memory leaks. On the other hand, the authors of the functools module themselves seemed to think that there was no problem at all. But then, how was it that I was getting the exact same issue as described by the reporter?9
Analyzing the source code of @functools.lru_cache()
This is how I ended up looking at the source code of the decorator. The experience was a bit rough, but it turned out to be quite enlightening10. Here's a diagram that summarizes how it works:
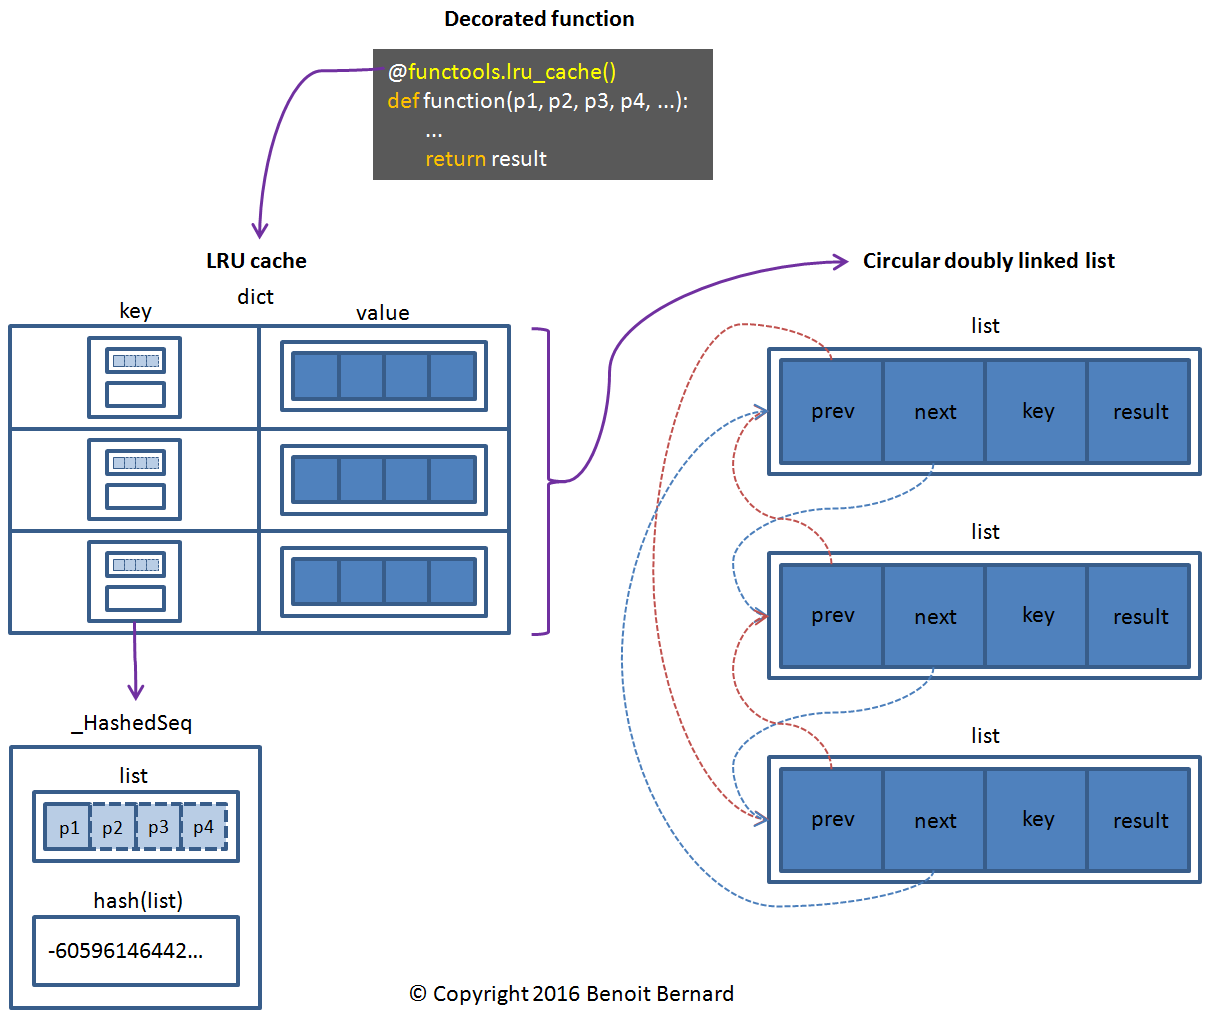
There are a few key things to understand here:
- The decorator creates a global cache. In human-readable terms: all instances of StandaloneWebCrawler share the same cache.
- The circular doubly linked list is mainly used to keep track of the oldest item stored in the cache, so that it can be evicted whenever a new item is added.
- The dictionary (dict) is used to maintain a specific number of items in memory (128 by default) and to make item lookup faster.
- The list in each _HashedSeq object contains all positional and keyword arguments passed to the decorated function. In human-readable terms: every single argument of crawl ends up in the list, including self, the StandaloneWebCrawler instance!
- result contains the result of the decorated function, following its evaluation.
So based solely on its source code, @functools.lru_cache() seemed to be all cute and nice. But was it the same in reality?
In particular:
- Were evicted items (Hyperlink objects) somehow still held in memory?
- Was the cache holding more items than it was supposed to?
- Was it caused by some sort of circular reference issue, thus preventing the garbage collector from freeing Hyperlink objects held in memory?
Settling it out using a unit test
I figured that a good way to answer my questions would be to create a small unit test, containing only a stripped-down version of my code. This is what I came up with:
import functools
import gc
import objgraph
import random
from crawlers.web.hyperlink import Hyperlink
from string import ascii_lowercase
_GLOBALLY_ALLOCATED_HYPERLINK_COUNTER = 0
_ENABLED_LAST_HYPERLINK_ALLOCATIONS_COUNTER = False
_LAST_HYPERLINK_ALLOCATIONS_COUNTER = 0
_NUM_PAGES_TO_CRAWL = 100000
class StandaloneWebCrawler:
    """
    A stripped-down version of my real StandaloneWebCrawler class.
    """
    @functools.lru_cache()
    def crawl(self, hyperlink):
        """
        Fake 'crawl' method used to test out the '@functools.lru_cache()' decorator.
        """
        # Return an arbitrary number of Hyperlink objects as if they were extracted for real from the crawled page.
        # Web pages typically contain between 1 and 300 hyperlinks.
        return [generate_hyperlink() for i in range(0, random.randint(1, 300))]
def generate_hyperlink():
    """
    Returns a randomly generated hyperlink.
    """
    # For every allocated Hyperlink object, increment the counter.
    global _GLOBALLY_ALLOCATED_HYPERLINK_COUNTER
    _GLOBALLY_ALLOCATED_HYPERLINK_COUNTER += 1
    # And only in the last few iterations (128), start counting the number of allocated Hyperlink objects.
    global _ENABLED_LAST_HYPERLINK_ALLOCATIONS_COUNTER, _LAST_HYPERLINK_ALLOCATIONS_COUNTER
    if _ENABLED_LAST_HYPERLINK_ALLOCATIONS_COUNTER:
        _LAST_HYPERLINK_ALLOCATIONS_COUNTER += 1
    # Note: here, I try to reproduce what happens for real with my web crawler:
    # -it encounters URLs of varying length and content.
    # -URLs typically have a length of between 5 and 100 characters.
    return Hyperlink(
        "http://{0}.com".format("".join([random.choice(ascii_lowercase) for i in range(0, random.randint(5, 100))])))
def test_leak():
    """
    Function used to tentatively reproduce the leak.
    """
    crawler = StandaloneWebCrawler()
    # Simulate the crawling of X web pages.
    global _NUM_PAGES_TO_CRAWL
    for i in range(0, _NUM_PAGES_TO_CRAWL):
        # Since the LRU cache stores up to 128 items by default, it means that the last 128 iterations
        # should store a predictable number of Hyperlink objects. So we count those allocations
        # separately.
        if _NUM_PAGES_TO_CRAWL - i == 128:
            global _ENABLED_LAST_HYPERLINK_ALLOCATIONS_COUNTER
            _ENABLED_LAST_HYPERLINK_ALLOCATIONS_COUNTER = True
        # Pass an arbitrary Hyperlink object to the 'crawl' method,
        # as if it were a real web page to crawl. To mimic what a real
        # web crawler does (i.e. extracting hyperlinks and then following them),
        # it returns an arbitrary number of Hyperlink objects as well. So in the LRU cache,
        # we end up with (1 Hyperlink, X Hyperlinks) mappings.
        result = crawler.crawl(generate_hyperlink())
        # Do nothing with the result.
        pass
    # Make sure that no objects that should have been garbage collected are left hanging in memory.
    gc.collect()
    # Display the number of iterations.
    print("--- Number of pages 'crawled' (iterations) ---")
    print(_NUM_PAGES_TO_CRAWL)
    # Display the most common Python objects in memory.
    print("\r\n--- Objects in memory when in the same scope as the 'crawler' object ---")
    objgraph.show_most_common_types(limit=20)
if __name__ == "__main__":
    # Call the test method.
    test_leak()
    # Display the most common Python objects in memory.
    print("\r\n--- Objects in memory when the 'crawler' object is out of scope ---")
    objgraph.show_most_common_types(limit=20)
    print("\r\n--- Number of Hyperlink objects allocated during the whole life of the process ---")
    print(_GLOBALLY_ALLOCATED_HYPERLINK_COUNTER)
    print("\r\n--- Number of Hyperlink objects allocated in the last 128 iterations ---")
    print(_LAST_HYPERLINK_ALLOCATIONS_COUNTER)
So I ran it and got the following output:
--- Number of pages 'crawled' (iterations) ---
100000
--- Objects in memory when in the same scope as the 'crawler' object ---
Hyperlink                  18445
function                   3302
tuple                      1089
wrapper_descriptor         1058
dict                       1019
...
SourceFileLoader           132
_HashedSeq                 128
WeakSet                    100
cell                       83
classmethod                81
--- Objects in memory when the 'crawler' object is out of scope ---
Hyperlink                  18445
function                   3302
tuple                      1089
wrapper_descriptor         1058
dict                       1019
...
SourceFileLoader           132
_HashedSeq                 128
WeakSet                    100
cell                       83
classmethod                81
--- Number of Hyperlink objects allocated during the whole life of the process ---
15183019
--- Number of Hyperlink objects allocated in the last 128 iterations ---
18445
Damn it! I was somehow expecting functools.lru_cache to leave rogue Hyperlink objects in memory, but this is NOT what had just happened:
- The cache was containing exactly 128 items, as evidenced by the 128 _HashedSeq objects held in memory.
- Those 128 items contained only the most recently created Hyperlink objects (that is, those created in the last 128 iterations of the script). All other objects (15M+) had been properly removed and garbage collected11.
- The cache created by the decorator was indeed global, because no matter if the crawler object was in scope or out of scope, it still held the last 128 items in memory.
And interestingly enough, the memory use of my Python process was extremely stable during the test:
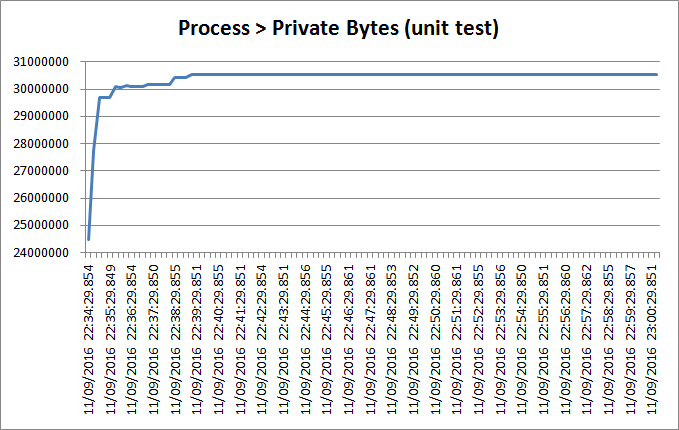
So I had clearly been misled about the functools.lru_cache decorator; it was not causing any memory leak.
Redefining what a Python memory leak is
Up to that point, I had been using the term "memory leak" in a very loose sense. And this bothered me, because it didn't perfectly fit the nice and clear definition that I had in my mind:
A memory leak is memory that has been allocated, that is not used anymore and that will never be released.
So, can a Python process really leak memory? Well, it turns out that it depends.
If we're talking about memory leaks in the Python interpreter itself or in a C module used by a Python package, then yes, it's entirely possible. But if we're strictly speaking about Python objects within pure Python code, then no, memory leaks are not possible - at least not in the traditional sense of the term. The reason is that Python has its own garbage collector (GC), so it should take care of cleaning up unused objects.
What's possible, though, is accumulating Python objects in memory and keeping strong references to them12. For instance, this happens when we build a cache (for example, a dict) that we never clear. The cache will hold references to every single item and the GC will never be able to destroy them, that is, unless the cache goes out of scope.
But thanks to my previous unit test, I had eliminated this latter possibility.
What about arena fragmentation?
There was a potential explanation that I hadn't thought about yet: arena fragmentation.
In case you don't know, Python has its own memory manager, so it's free to decide when it returns unused memory to the operating system (OS).
There used to be an issue in older versions of Python (<3.3) where a long-running program creating a lot of small and short-lived objects would cause some internally managed memory structures (called arenas) to become heavily fragmented, thus exhibiting a high-water behavior.
But apparently, this problem has been resolved in Python 3.3, so I could rule it out right away.
Using VMMap to analyze heap fragmentation
Quiz question: what's as obscure as arena fragmentation?
Answer: heap fragmentation.
Processes in Windows typically use heaps to manage their memory. These are reserved chunks of memory in the virtual memory system of Windows.
In this respect, Python processes are no exception; they use a private heap to manage their memory, and it can become fragmented13. Unfortunately, Python's garbage collector doesn't have a memory compactor, so we have no control over heap fragmentation.
But, well, I still had to it rule out. So I used the great VMMap, a tool that allows you to see the level of fragmentation of a process' heaps.
Here's what I did:
- I started VMMap.
- In the Select or Launch Process dialog, I chose the Python process and hit OK.
- In the middle panel, I chose the "Heap" type. And this is what I saw at the bottom of the screen:
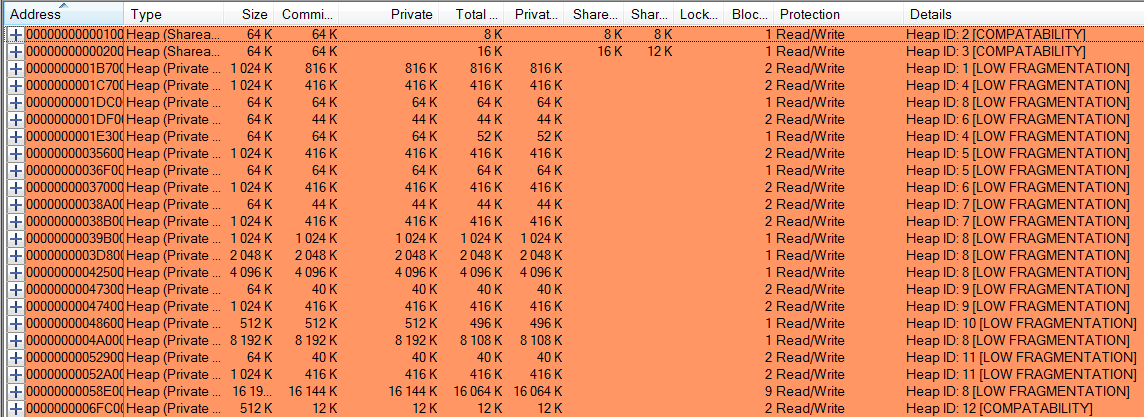
It indicated that all heaps had low fragmentation; therefore I could definitively rule it out as a possible explanation to my issue.
Using umdh to search for C-based memory leaks
There was one last suspect that I had consciously ignored from the start: a native C memory leak. Because, after all, why would the Python interpreter or some well-known Python library cause a memory leak?14
This is how I ended up using umdh, to which I was no stranger. It allows you to take memory snapshots of a process and to compare them to find potential memory leaks.
So here's what I did:
- I installed Debugging Tools for Windows15.
I enabled debugging for the Python process:
C:\Program Files\Debugging Tools for Windows (x64)>gflags /i python.exe +ust
Current Registry Settings for python.exe executable are: 00001000
    ust - Create user mode stack trace database
I downloaded the debugging symbols of my Python version (3.3.5)16:
C:\Program Files\Debugging Tools for Windows (x64)>cd c:\tmp
c:\tmp>curl -O https://www.python.org/ftp/python/3.3.5/python-3.3.5.amd64-pdb.zip
  % Total    % Received % Xferd  Average Speed   Time    Time     Time  Current
                                 Dload  Upload   Total   Spent    Left  Speed
100 21.1M  100 21.1M    0     0   540k      0  0:00:40  0:00:40 --:--:--  629k
I extracted all .pdb files contained in the downloaded ZIP file:
c:\tmp>"C:\Program Files\7-Zip\7z.exe" e python-3.3.5.amd64-pdb.zip -oC:\Python33\Symbols
7-Zip [64] 9.20  Copyright (c) 1999-2010 Igor Pavlov  2010-11-18
Processing archive: python-3.3.5.amd64-pdb.zip
Extracting  pyexpat.pdb
Extracting  python.pdb
Extracting  python33.pdb
...
Extracting  _testbuffer.pdb
Extracting  _testcapi.pdb
Extracting  _tkinter.pdb
Everything is Ok
Files: 24
Size:       22159360
Compressed: 22161782
I added the _NT_SYMBOL_PATH and OANOCACHE environment variables to define where my debugging symbols were and to disable BSTR caching:
c:\tmp>set _NT_SYMBOL_PATH=C:\Python33\Symbols;srv*c:\mycache*https://msdl.microsoft.com/download/symbols
c:\tmp>set OANOCACHE=1
I took a first snapshot of the Python process17:
c:\tmp>cd "c:\program files\Debugging Tools for Windows (x64)"
C:\Program Files\Debugging Tools for Windows (x64)>umdh -p:11452 -f:c:\tmp\umdh1.txt
Several minutes later, I took a second snapshot:
C:\Program Files\Debugging Tools for Windows (x64)>umdh -p:11452 -f:c:\tmp\umdh2.txtI compared both snapshots:
C:\Program Files\Debugging Tools for Windows (x64)>umdh -d c:\tmp\umdh1.txt c:\tmp\umdh2.txt > c:\tmp\umdh_1_2.txtFinally, I opened the comparison file (umdh_1_2.txt) and saw the following18:
...
//
// Each log entry has the following syntax:
//
// + BYTES_DELTA (NEW_BYTES - OLD_BYTES) NEW_COUNT allocs BackTrace TRACEID
// + COUNT_DELTA (NEW_COUNT - OLD_COUNT) BackTrace TRACEID allocations
//     ... stack trace ...
//
// where:
//
//     BYTES_DELTA - increase in bytes between before and after log
//     NEW_BYTES - bytes in after log
//     OLD_BYTES - bytes in before log
//     COUNT_DELTA - increase in allocations between before and after log
//     NEW_COUNT - number of allocations in after log
//     OLD_COUNT - number of allocations in before log
//     TRACEID - decimal index of the stack trace in the trace database
//         (can be used to search for allocation instances in the original
//         UMDH logs).
//
+  313472 ( 324640 -  11168)  10145 allocs    BackTrace7814620
+    9796 (  10145 -    349)    BackTrace7814620    allocations
    ntdll! ?? ::FNODOBFM::`string'+000153EB
    MSVCR100!malloc+0000005B (f:\dd\vctools\crt_bld\self_64_amd64\crt\src\malloc.c, 89)
    etree!PyInit_etree+0004A191
    etree!PyInit_etree+000657C2
    etree!PyInit_etree+00066394
    ...
    etree!???+00000000 : 7FEDBFAA287
    etree!???+00000000 : 7FEDBFB2C0C
    etree!???+00000000 : 7FEDBFC52AC
    ...
    python33!PyEval_EvalFrameEx+00002041 (c:\users\martin\33.amd64\python\python\ceval.c, 2723)
    python33!PyEval_EvalCodeEx+0000065C (c:\users\martin\33.amd64\python\python\ceval.c, 3436)
    python33!fast_function+0000014D (c:\users\martin\33.amd64\python\python\ceval.c, 4168)
    python33!call_function+00000339 (c:\users\martin\33.amd64\python\python\ceval.c, 4088)
    python33!PyEval_EvalFrameEx+00001F98 (c:\users\martin\33.amd64\python\python\ceval.c, 2681)
+  161280 ( 233408 -  72128)   1042 allocs    BackTrace79BBB20
+     720 (   1042 -    322)    BackTrace79BBB20    allocations
    ntdll! ?? ::FNODOBFM::`string'+000153EB
    MSVCR100!malloc+0000005B (f:\dd\vctools\crt_bld\self_64_amd64\crt\src\malloc.c, 89)
    python33!new_keys_object+00000037 (c:\users\martin\33.amd64\python\objects\dictobject.c, 352)
    python33!_PyDict_NewPresized+00000023 (c:\users\martin\33.amd64\python\objects\dictobject.c, 1046)
    python33!PyEval_EvalFrameEx+0000185D (c:\users\martin\33.amd64\python\python\ceval.c, 2246)
    ...
    python33!do_call+0000011A (c:\users\martin\33.amd64\python\python\ceval.c, 4286)
    python33!call_function+00000346 (c:\users\martin\33.amd64\python\python\ceval.c, 4091)
    python33!PyEval_EvalFrameEx+00001F98 (c:\users\martin\33.amd64\python\python\ceval.c, 2681)
    python33!PyEval_EvalCodeEx+0000065C (c:\users\martin\33.amd64\python\python\ceval.c, 3436)
    python33!fast_function+0000014D (c:\users\martin\33.amd64\python\python\ceval.c, 4168)
+   92128 ( 133728 -  41600)   1053 allocs    BackTrace6A19960
+     719 (   1053 -    334)    BackTrace6A19960    allocations
    ntdll! ?? ::FNODOBFM::`string'+000153EB
    MSVCR100!malloc+0000005B (f:\dd\vctools\crt_bld\self_64_amd64\crt\src\malloc.c, 89)
    python33!new_dict_with_shared_keys+0000004E (c:\users\martin\33.amd64\python\objects\dictobject.c, 420)
    python33!_PyObjectDict_SetItem+00000057 (c:\users\martin\33.amd64\python\objects\dictobject.c, 3702)
    python33!_PyObject_GenericSetAttrWithDict+000000E1 (c:\users\martin\33.amd64\python\objects\object.c, 1191)
    ...
    python33!type_call+000000CF (c:\users\martin\33.amd64\python\objects\typeobject.c, 744)
    python33!PyObject_Call+00000061 (c:\users\martin\33.amd64\python\objects\abstract.c, 2036)
    python33!do_call+0000011A (c:\users\martin\33.amd64\python\python\ceval.c, 4286)
    python33!call_function+00000346 (c:\users\martin\33.amd64\python\python\ceval.c, 4091)
    python33!PyEval_EvalFrameEx+00001F98 (c:\users\martin\33.amd64\python\python\ceval.c, 2681)
...
Ouch! Apparently, there were several potential memory leaks:
- 313472 bytes (through 10145 allocations) had been leaked while initializing some etree module.
- 161280 bytes (through 1042 allocations) had been leaked while creating and initializing a dictionary.
- 92128 bytes (through 1053 allocations) had been leaked while setting some object's attribute.
The first potential leak seemed quite severe (10145 allocations), especially when compared to the last two ones.
Getting lxml's long-lost debugging symbols
So, what kind of beast is the etree module exactly?
It's a C module part of lxml, a library that my crawler uses to parse HTML pages and extract hyperlinks. But I didn't have its debugging symbols19, so I couldn't see the exact sequence of calls that had led to the memory leaks. This was evidenced by the missing function names in the umdh log:
...
etree!PyInit_etree+000621B9
...
etree!???+00000000 : 7FEDBF962C0
etree!???+00000000 : 7FEDBF98EA6
etree!???+00000000 : 7FEDBFAA287
etree!???+00000000 : 7FEDBFB2C0C
etree!???+00000000 : 7FEDBFC52AC
...
So I performed some quirky gymnastics to build lxml and its dependencies myself and to generate the necessary .pdb files. I ended up with a wheel file, containing the debugging symbols that I needed.
Finally, I uninstalled lxml, and then installed the wheel file I had just compiled:
(env) G:\crawler>pip uninstall lxml
  ...
  Successfully uninstalled lxml-3.5.0
(env) G:\crawler>pip install c:\tmp\lxml-3.6.4\dist\lxml-3.6.4-cp33-none-win_amd64.whl
Processing c:\tmp\lxml-3.6.4\dist\lxml-3.6.4-cp33-none-win_amd64.whl
Installing collected packages: lxml
Successfully installed lxml-3.6.4
The problem
So I restarted my crawler20, let it run for several minutes and re-took a couple of memory snapshots using umdh. Then I generated a comparison file.
I was quite excited to finally have a glimpse of what the problem was!
+   63776 (  69440 -   5664)   2170 allocs    BackTrace7922D60
+    1993 (   2170 -    177)    BackTrace7922D60    allocations
    ntdll! ?? ::FNODOBFM::`string'+000153EB
    ucrtbase!malloc+00000031
    etree!xmlDictLookup+0000025E (c:\tmp\libxml2-win-binaries\libxml2\dict.c, 933)
    etree!xmlHashAddEntry3+00000053 (c:\tmp\libxml2-win-binaries\libxml2\hash.c, 532)
    etree!xmlHashAddEntry+00000014 (c:\tmp\libxml2-win-binaries\libxml2\hash.c, 377)
    etree!xmlAddID+0000011D (c:\tmp\libxml2-win-binaries\libxml2\valid.c, 2632)
    etree!xmlSAX2AttributeInternal+0000078A (c:\tmp\libxml2-win-binaries\libxml2\sax2.c, 1411)
    etree!xmlSAX2StartElement+000002AE (c:\tmp\libxml2-win-binaries\libxml2\sax2.c, 1743)
    etree!htmlParseStartTag+00000579 (c:\tmp\libxml2-win-binaries\libxml2\htmlparser.c, 3926)
    etree!htmlParseElementInternal+00000069 (c:\tmp\libxml2-win-binaries\libxml2\htmlparser.c, 4467)
    etree!htmlParseContentInternal+000003D3 (c:\tmp\libxml2-win-binaries\libxml2\htmlparser.c, 4652)
    etree!htmlParseDocument+000002A2 (c:\tmp\libxml2-win-binaries\libxml2\htmlparser.c, 4818)
    etree!htmlDoRead+00000094 (c:\tmp\libxml2-win-binaries\libxml2\htmlparser.c, 6786)
    etree!htmlCtxtReadMemory+00000093 (c:\tmp\libxml2-win-binaries\libxml2\htmlparser.c, 7072)
    etree!__pyx_f_4lxml_5etree_11_BaseParser__parseUnicodeDoc+0000028A (c:\tmp\lxml-3.6.4\src\lxml\lxml.etree.c, 109222)
    etree!__pyx_f_4lxml_5etree__parseDoc+0000041F (c:\tmp\lxml-3.6.4\src\lxml\lxml.etree.c, 115220)
    etree!__pyx_f_4lxml_5etree__parseMemoryDocument+000000E6 (c:\tmp\lxml-3.6.4\src\lxml\lxml.etree.c, 116674)
    etree!__pyx_pf_4lxml_5etree_22fromstring+00000086 (c:\tmp\lxml-3.6.4\src\lxml\lxml.etree.c, 77737)
    etree!__pyx_pw_4lxml_5etree_23fromstring+00000294 (c:\tmp\lxml-3.6.4\src\lxml\lxml.etree.c, 77687)
    ...
    python33!PyEval_EvalFrameEx+00002041 (c:\users\martin\33.amd64\python\python\ceval.c, 2723)
    python33!PyEval_EvalCodeEx+0000065C (c:\users\martin\33.amd64\python\python\ceval.c, 3436)
    python33!fast_function+0000014D (c:\users\martin\33.amd64\python\python\ceval.c, 4168)
    python33!call_function+00000339 (c:\users\martin\33.amd64\python\python\ceval.c, 4088)
    python33!PyEval_EvalFrameEx+00001F98 (c:\users\martin\33.amd64\python\python\ceval.c, 2681)
    ...
+    6048 (   7328 -   1280)    229 allocs    BackTrace7819DE0
+     189 (    229 -     40)    BackTrace7819DE0    allocations
    ntdll! ?? ::FNODOBFM::`string'+000153EB
    ucrtbase!malloc+00000031
    etree!xmlDictLookup+0000025E (c:\tmp\libxml2-win-binaries\libxml2\dict.c, 933)
    etree!htmlParseHTMLName+000000C8 (c:\tmp\libxml2-win-binaries\libxml2\htmlparser.c, 2409)
    etree!htmlParseStartTag+00000315 (c:\tmp\libxml2-win-binaries\libxml2\htmlparser.c, 3834)
    etree!htmlParseElementInternal+00000069 (c:\tmp\libxml2-win-binaries\libxml2\htmlparser.c, 4467)
    etree!htmlParseContentInternal+000003D3 (c:\tmp\libxml2-win-binaries\libxml2\htmlparser.c, 4652)
    etree!htmlParseDocument+000002A2 (c:\tmp\libxml2-win-binaries\libxml2\htmlparser.c, 4818)
    etree!htmlDoRead+00000094 (c:\tmp\libxml2-win-binaries\libxml2\htmlparser.c, 6786)
    etree!htmlCtxtReadMemory+00000093 (c:\tmp\libxml2-win-binaries\libxml2\htmlparser.c, 7072)
    etree!__pyx_f_4lxml_5etree_11_BaseParser__parseUnicodeDoc+0000028A (c:\tmp\lxml-3.6.4\src\lxml\lxml.etree.c, 109222)
    etree!__pyx_f_4lxml_5etree__parseDoc+0000041F (c:\tmp\lxml-3.6.4\src\lxml\lxml.etree.c, 115220)
    etree!__pyx_f_4lxml_5etree__parseMemoryDocument+000000E6 (c:\tmp\lxml-3.6.4\src\lxml\lxml.etree.c, 116674)
    etree!__pyx_pf_4lxml_5etree_22fromstring+00000086 (c:\tmp\lxml-3.6.4\src\lxml\lxml.etree.c, 77737)
    etree!__pyx_pw_4lxml_5etree_23fromstring+00000294 (c:\tmp\lxml-3.6.4\src\lxml\lxml.etree.c, 77687)
    ...
    python33!PyEval_EvalFrameEx+00001F98 (c:\users\martin\33.amd64\python\python\ceval.c, 2681)
    python33!fast_function+000000D8 (c:\users\martin\33.amd64\python\python\ceval.c, 4155)
    python33!call_function+00000339 (c:\users\martin\33.amd64\python\python\ceval.c, 4088)
    python33!PyEval_EvalFrameEx+00001F98 (c:\users\martin\33.amd64\python\python\ceval.c, 2681)
    python33!fast_function+000000D8 (c:\users\martin\33.amd64\python\python\ceval.c, 4155)
    ...
+    1440 (   1568 -    128)     49 allocs    BackTrace7922FA0
+      45 (     49 -      4)    BackTrace7922FA0    allocations
    ntdll! ?? ::FNODOBFM::`string'+000153EB
    ucrtbase!malloc+00000031
    etree!xmlDictLookup+0000025E (c:\tmp\libxml2-win-binaries\libxml2\dict.c, 933)
    etree!htmlParseName+000000C3 (c:\tmp\libxml2-win-binaries\libxml2\htmlparser.c, 2482)
    etree!htmlParseEntityRef+00000054 (c:\tmp\libxml2-win-binaries\libxml2\htmlparser.c, 2699)
    etree!htmlParseHTMLAttribute+0000012E (c:\tmp\libxml2-win-binaries\libxml2\htmlparser.c, 2602)
    etree!htmlParseAttValue+0000002B (c:\tmp\libxml2-win-binaries\libxml2\htmlparser.c, 2746)
    etree!htmlParseStartTag+0000039D (c:\tmp\libxml2-win-binaries\libxml2\htmlparser.c, 3834)
    etree!htmlParseElementInternal+00000069 (c:\tmp\libxml2-win-binaries\libxml2\htmlparser.c, 4467)
    etree!htmlParseContentInternal+000003D3 (c:\tmp\libxml2-win-binaries\libxml2\htmlparser.c, 4652)
    etree!htmlParseDocument+000002A2 (c:\tmp\libxml2-win-binaries\libxml2\htmlparser.c, 4818)
    etree!htmlDoRead+00000094 (c:\tmp\libxml2-win-binaries\libxml2\htmlparser.c, 6786)
    etree!htmlCtxtReadMemory+00000093 (c:\tmp\libxml2-win-binaries\libxml2\htmlparser.c, 7072)
    etree!__pyx_f_4lxml_5etree_11_BaseParser__parseUnicodeDoc+0000028A (c:\tmp\lxml-3.6.4\src\lxml\lxml.etree.c, 109222)
    etree!__pyx_f_4lxml_5etree__parseDoc+0000041F (c:\tmp\lxml-3.6.4\src\lxml\lxml.etree.c, 115220)
    etree!__pyx_f_4lxml_5etree__parseMemoryDocument+000000E6 (c:\tmp\lxml-3.6.4\src\lxml\lxml.etree.c, 116674)
    etree!__pyx_pf_4lxml_5etree_22fromstring+00000086 (c:\tmp\lxml-3.6.4\src\lxml\lxml.etree.c, 77737)
    etree!__pyx_pw_4lxml_5etree_23fromstring+00000294 (c:\tmp\lxml-3.6.4\src\lxml\lxml.etree.c, 77687)
    ...
    python33!PyEval_EvalCodeEx+0000065C (c:\users\martin\33.amd64\python\python\ceval.c, 3436)
    python33!fast_function+0000014D (c:\users\martin\33.amd64\python\python\ceval.c, 4168)
    python33!call_function+00000339 (c:\users\martin\33.amd64\python\python\ceval.c, 4088)
    python33!PyEval_EvalFrameEx+00001F98 (c:\users\martin\33.amd64\python\python\ceval.c, 2681)
    python33!fast_function+000000D8 (c:\users\martin\33.amd64\python\python\ceval.c, 4155)
Wait, what?! There were apparently 3 different memory leaks related to lxml! And they had all occurred while parsing HTML pages, as evidenced by a call to etree.fromstring in every callstack. Then, etree.fromstring() called a series of functions, all the way down to libxml2 - one of lxml's dependencies - where the actual leaks occurred.
A bit of googling revealed that the first leak is a known issue in lxml that has not been resolved yet. Apparently, libxml2 keeps an internal dictionary of HTML ID attributes, and lxml is never able to clear it, thus causing memory leaks.
For the second and third leaks, I was a bit out of luck, as they didn't appear to have been reported yet. Was I the lucky lottery memory leak winner? Would I have to dig into the rather huge codebase of libxml2?
Stay tuned to know what I did next!
Final thoughts
Tracking down memory leaks can be quite hard. There's no magic pill, really. This is true for applications written in Python, but also for those written in any other programming language.
The fact that I'm using Windows on my development box certainly didn't help; Windows just doesn't come shipped with a compiler and a package manager by default, as is often the case for Linux. So installing and building the required libraries (and their dependencies) can be a pain.
But don't despair, fellow Python programmer! Because you can track down pretty much any memory leak by using the right tools:
- Use Perfmon to monitor the memory allocated by the Python process you suspect has a leak.
- Use objgraph to determine whether the problem is that you simply create too many Python objects and you keep them in memory. Analyze your project's source code and create small unit tests to validate your hypotheses.
- Use VMMap to rule out heap fragmentation.
- Use umdh to determine where the leaks are, especially if your code uses libraries built over C extensions.
But what about you? What are your favorite tools when it comes to tracking down memory leaks? And was my post helpful to you? If so, please share your comments in the comment section below!
Update (09/12/2016): this post was featured in Reddit and in Hacker News. It was also featured in the Python Weekly, Pycoders's Weekly, Awesome Python and ImportPython newsletters. Thanks to everyone for your support and your great feedback!
My development machine is a Windows laptop, and I deploy my code in production on CentOS 7 virtual machines. It's clearly not a perfect match, but it works! ↩
Alternatively, on Linux, you can use the great dstat to monitor the performance of a process. ↩
"Private Bytes" refer to the memory allocated by a process, as explained here. This is a Windows term, and more specifically, one used by Performance Monitor. In Linux, a loosely equivalent metric is Resident Memory Size (RES), but contrary to private bytes, it doesn't include swapped out memory. ↩
You may have to collect data for shorter or longer periods of time, depending on how fast memory leaks manifest themselves. In my case, memory use never stabilized. ↩
Since I use a specific version of Python for my crawler (e.g. Python 3.3.5), activating my virtual environment is mandatory. ↩
Alternatively, under Linux, you could attach to the process with gdb, as I explained in my previous blog post. Then you could start a Python interpreter from within gdb, import objgraph and then use it. I tested it on a CentOS 7 virtual machine and it works perfectly. ↩
You absolutely need to re-import objgraph, because the Python prompt completely forgets about it in between interruptions of the program. ↩
As explained in objgraph's documentation, I could have installed xdot to open the graph directly in an interactive viewer, but I prefer to work directly with PNG files. ↩
At that time, I must say that I didn't have sufficient knowledge of the inner workings of the lru_cache decorator to really grasp the subtleties of the bug report. ↩
Enlightening as in "dismantling your car's motor is enlightening". But it wasn't necessarily pure joy! :) ↩
Proof: 18445 Hyperlink objects were remaining in memory at the end of the script, which corresponds exactly to the number of such objects that had been created in the last 128 iterations of the script. This was no coincidence; those were the same objects. So the LRU cache was doing its job perfectly. ↩
By default, any reference to a Python object is a strong reference, meaning that this object will be kept alive as long as the reference exists. We can also use weak references using the weakref module; those are not sufficient to keep an object alive. ↩
Since Windows Vista, the low-fragmentation heap has apparently been in use, thus reducing - but not necessarily eliminating - heap fragmentation. ↩
Life lesson: from the start, being a bit more sceptical about our tools is probably always a good thing. ↩
You need to make sure that the version of Debugging Tools for Windows that you install matches the bittage of your Python version (i.e. x86 or x64), otherwise umdh won't work properly. ↩
You can use this page to find the debugging symbols of your specific Python version. ↩
Be patient! Taking the first snapshot may take several minutes, because umdh will download the debugging symbols of Windows in c:\mycache (or whatever folder that you specified). ↩
This is only a truncated excerpt coming from umdh's comparison file. There were actually many more potential memory leaks indicated in the file, but I kept them out for brevity. ↩
lxml is actually a weird mixture of pure Python and Cython code. When you install it with pip, it downloads a package already containing a Cython-generated version of lxml.etree.c, that is, the source code of the etree module. Unfortunately, it doesn't come shipped with its corresponding debugging symbols (.pdb files), so I was a bit out of luck. ↩
You now have proof that I'm a fairly patient person. ↩